
Articles
- Page Path
- HOME > Epidemiol Health > Volume 46; 2024 > Article
-
Original Article
Association of insomnia and daytime napping with metabolic syndrome and its components in a Korean population: an analysis of data from the Korean Genome and Epidemiology Study -
Da-Been Lee1,2
 , Dae-Wui Yoon2,3, Inkyung Baik4
 -
Epidemiol Health 2024;46:e2024031.
DOI: https://doi.org/10.4178/epih.e2024031
Published online: February 20, 2024
1Department of Health and Environmental Science, Korea University, Seoul, Korea
2Sleep Medicine Institute, Jungwon University, Goesan, Korea
3Department of Biomedical Laboratory Science, Jungwon University, Goesan, Korea
4Department of Foods and Nutrition, Kookmin University College of Natural Sciences, Seoul, Korea
- Correspondence: Dae-Wui Yoon Department of Biomedical Laboratory Science, Jungwon University, 85 Munmu-ro, Goesan 28204, Korea E-mail: ydw@jwu.ac.kr
- Co-correspondence: Inkyung Baik Department of Foods and Nutrition, Kookmin University College of Natural Sciences, 77 Jeongneung-ro, Seongbuk-gu, Seoul 02707, Korea E-mail: ibaik@kookmin.ac.kr
© 2024, Korean Society of Epidemiology
This is an open-access article distributed under the terms of the Creative Commons Attribution License (http://creativecommons.org/licenses/by/4.0/), which permits unrestricted use, distribution, and reproduction in any medium, provided the original work is properly cited.
- 2,055 Views
- 93 Download
Abstract
-
OBJECTIVES
- We investigated the association between metabolic syndrome (MetS) and the coexistence of insomnia and daytime napping, because limited data have been reported regarding this association.
-
METHODS
- The study population was 8,440 participants aged 40-65 years, who were from the Korean Genome and Epidemiology Study. Self-reported information on insomnia symptoms and nap duration was used to define exposure variables. Data on waist circumference (WC), blood pressure (BP), and fasting blood glucose (FBG), triglyceride (TG), and high-density lipoprotein cholesterol levels in blood were used to define MetS. Multivariate logistic regression analysis was performed to obtain odds ratio (OR) and 95% confidence interval (CI).
-
RESULTS
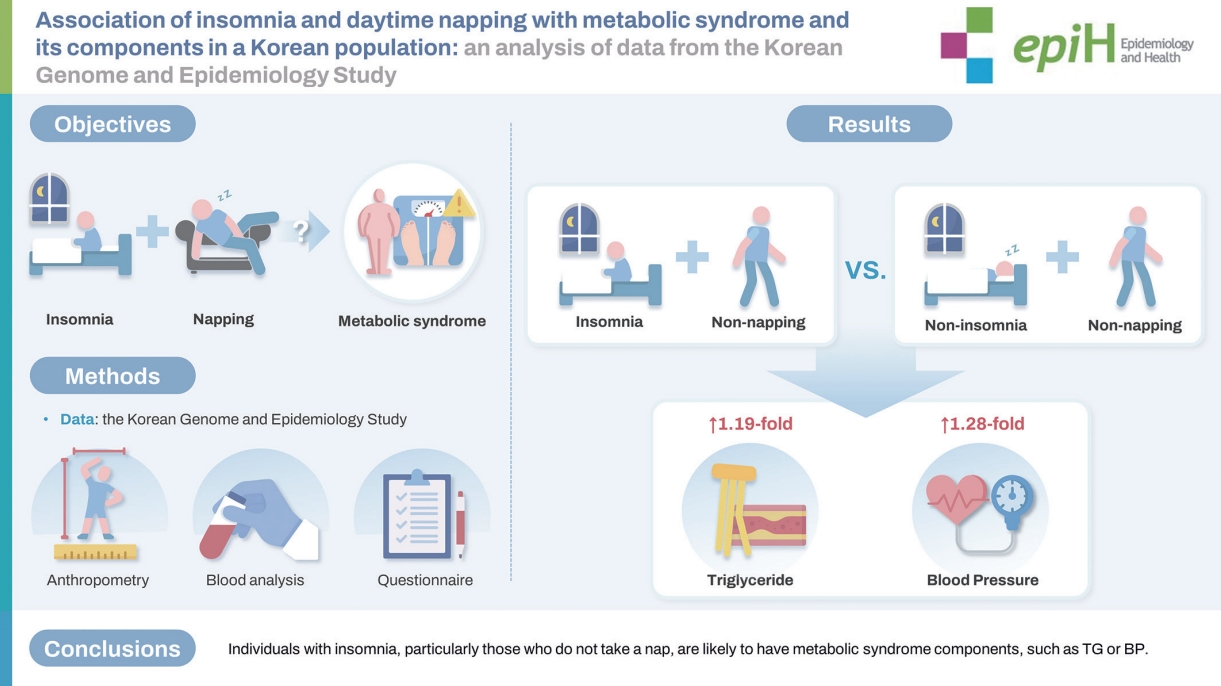
- In multivariate logistic regression analysis, the coexistence of insomnia and napping was not significantly associated with MetS. However, the insomnia and non-napping group showed higher ORs of high TG (OR, 1.19; 95% CI, 1.02 to 1.39) and high BP (OR, 1.28; 95% CI, 1.10 to 1.49) than the non-insomnia and non-napping group. The combination of non-insomnia and napping and that of insomnia and napping showed higher ORs of high TG (OR, 1.13; 95% CI, 1.00 to 1.29) and high FBG (OR, 1.59; 95% CI, 1.14 to 2.21), respectively. In analyses of insomnia symptoms, only the combination of difficulty in maintaining sleep (DMS) and non-napping showed a higher OR for MetS (OR, 1.25; 95% CI, 1.03 to 1.52) than the non-DMS and non-napping group.
-
CONCLUSIONS
- Individuals with insomnia, particularly those who do not take naps, were disproportionately likely to have MetS components, especially TG or BP. Information on these variables may help predict individuals’ vulnerability to specific MetS components.
- • The significant association of insomnia with MetS components varies with the presence or absence of napping.
- • Individuals with insomnia who do not take naps were likely to have MetS components, especially TG or BP.
Key Message
- Metabolic syndrome (MetS) is a set of 5 conditions that increase the likelihood of developing cardiovascular and metabolic diseases. Individuals with MetS face a two-fold increase in the risk of cardiovascular disease (CVD) and are 5 times more likely to develop diabetes mellitus than those without MetS [1-3].
- Overweight and obesity, lifestyle habits such as smoking, drinking, and shift work, genetic factors, sex, and medical conditions are recognized as risk factors for MetS. Recent research indicates that both the quantity and quality of sleep are linked to MetS. A population-based study utilizing data from the 2013-2014 National Health and Nutrition Examination Survey (NHANES) found a U-shaped relationship between sleep duration and the risk of MetS [4]. Numerous cross-sectional and longitudinal studies have identified a significant relationship between insomnia and MetS. One longitudinal study investigating the link between insomnia and MetS, along with its components, revealed that transitioning from restful sleep to insomnia was associated with an increased risk of developing MetS and hypertriglyceridemia [5]. Additionally, several cross-sectional studies in various ethnic groups have demonstrated independent associations between insomnia or specific symptoms of insomnia and MetS [6-8].
- In addition to complaints of nighttime sleep disturbances, daytime napping has also been linked to MetS. Studies have demonstrated that habitual napping is independently associated with an increased prevalence [9] and incidence [10] of MetS and its components.
- While research on the effects of napping on MetS has consistently yielded negative results, napping has been shown to have a positive impact on counteracting the bodily dysfunctions caused by sleep loss or sleep complaints. Non-restorative sleep (NRS) has been associated with an increased risk of developing hypertension (HTN) [11]. Xu et al. [12] reported that napping could reverse the cognitive impairments caused by sleep deprivation, and another study indicated that abstaining from napping significantly reduced episodic memory [13]. These findings suggest that in cases of sleep issues such as sleep deprivation or insomnia, recuperative sleep obtained through napping can have beneficial effects on the body.
- Although insomnia and napping have each been individually associated with MetS and its components, to our knowledge, there has been no report on the association between the co-occurrence of insomnia and daytime napping with MetS. Therefore, this study evaluated the associations between the combination of insomnia and napping with MetS and its components in Korean adults.
INTRODUCTION
- Study population
- The current study utilized data from the Ansan and Ansung cohort study, which were obtained from the Korea Disease Control and Prevention Agency. A detailed description of these cohort studies is available in previous reports [14,15]. Briefly, the cohort studies commenced in 2001 as part of the Korean Genome and Epidemiology Study. Approximately 10,000 Korean male and female adults, aged 40 years to 69 years and residing in Ansan and Ansung, were enrolled as cohort members. They were invited to undergo health examinations on-site from June 2001 to January 2003. In total, 9,996 members completed the examination, which included anthropometric and clinical assessments, blood collection for biochemical and genetic assays, and a questionnaire-based interview. The questionnaire covered socio-demographics, medical history and health conditions, and lifestyle factors, including sleep status.
- Definitions of daytime napping, insomnia, and metabolic syndrome
- In the questionnaire-based interview, participants were asked to detail their sleep patterns, including nighttime sleep duration, daytime napping frequency and duration, and the presence of insomnia symptoms. If participants indicated that they took daytime naps, they were further queried about the average minutes spent napping each day. Based on their responses, napping was categorized as taking a nap for more than 1 hour, while non-napping was defined as either not napping at all or taking a short nap of less than 1 hour. This categorization aligns with definitions used in prior studies [9,16]. The information on insomnia symptoms was available in the questionnaire and used to define insomnia. Participants responded to the following questions: (1) “Do you have difficulty falling asleep at night?” (difficulty initiating sleep, DIS), (2) “Do you wake up during the night and have difficulty falling back asleep?” (difficulty maintaining sleep, DMS), (3) “Do you wake up too early in the morning?” (early morning awakenings, EMA), and (4) “Do you feel refreshed when you woke up in the morning?” (non-restorative sleep, NRS). They were instructed to answer “yes” or “no” to these questions. For affirmative responses, they were asked to specify the frequency of their experiences, with options such as very rarely, sometimes, often, and almost every day (1= never, 2= 1-2, 3= 3-4, and 4= ≥ 5 times/wk). Individuals reporting any of these 4 symptoms with a frequency of more than 3-4 times/wk (score ≥ 3 on any item) were classified as having insomnia symptoms, irrespective of their use of sleep medication. Groups with insomnia were then formed based on the frequency of reported insomnia symptoms at each time point.
- MetS was defined as the presence of ≥ 3 of the following 5 criteria, according to the National Cholesterol Education Program Adult Treatment Panel III [17]: (1) abdominal obesity, characterized by a waist circumference of ≥ 90 cm for male and ≥ 80 cm for female; (2) hypertriglyceridemia, with serum triglyceride (TG) levels of ≥ 150 mg/dL; (3) low high-density lipoprotein (HDL)- cholesterol, defined as < 40 mg/dL for male and < 50 mg/dL for female; (4) HTN, indicated by a systolic/diastolic pressure of ≥ 130/85 mmHg or the use of antihypertensive medications; (5) high fasting blood glucose (FBG), with levels of ≥ 100 mg/dL or the use of antidiabetic medications.
- Anthropometric and biochemical measurements
- All participants underwent anthropometric measurements. Weights and heights were recorded to the nearest 0.1 kg and 0.1 cm, respectively. Subsequently, body mass index (BMI) was calculated by dividing the weight (kg) by the square of the height (m2). Blood pressure (BP) was measured non-invasively while participants were seated, using a mercury sphygmomanometer by trained personnel. Physical activity levels were quantified in metabolic equivalent (MET)-hr/day. Blood samples were collected from participants after an overnight fast. Serum levels of blood glucose, TG, and HDL-cholesterol were measured using an ADVIA 1650 autoanalyzer (Siemens, Tarrytown, NY, USA) at a commercial laboratory (Seoul Clinical Laboratories, Seoul, Korea).
- Statistical analysis
- Data are expressed as mean± standard deviation. One-way analysis of variance for continuous variables and the chi-square test for categorical variables were used. Univariate and multivariate logistic regression analyses were conducted to calculate odds ratios (ORs) and 95% confidence intervals (CIs) for the associations of MetS and MetS components with napping, insomnia, and insomnia symptoms. Age (continuous), sex (male or female), BMI (continuous), education level (high school or college), smoking status (non-smoker or current smoker), alcohol consumption status (past drinker or current drinker), physical activity (MET-hr/day; continuous), and presence of obstructive sleep apnea (OSA; no or yes) were included as covariates in the multivariate logistic regression analysis. All statistical analyses were performed using SAS version 9.4 (SAS Institute Inc., Cary, NC, USA), and a p-value < 0.05 was considered statistically significant.
- Ethics statement
- All participants provided written informed consent at 2 study sites, Korea University Ansan Hospital and Ajou University Medical Center. The current study received approval from the Institutional Review Board of Jungwon University (1044297-HR-202306-002-01).
MATERIALS AND METHODS
- Characteristics of the study population
- Table 1 presents the general characteristics of the study population. Out of the 8,440 participants with complete data, 2,490 (29.5%) were diagnosed with MetS. Those with MetS tended to be older, have a higher body weight, and were more likely to be male, current smokers, and current drinkers than participants without MetS. Among the participants, 20.3% reported regular daily napping, while 64.9% experienced insomnia. The frequency of napping did not significantly differ between those with and without MetS. However, the prevalence of insomnia was significantly higher in participants with MetS. Notably, the symptoms of EMA and NRS were more common among those with MetS. Significant differences were also observed in sleep duration and the number of OSA events between participants with and without MetS.
- Table 2 shows the characteristics of participants with regard to napping and insomnia. Education level and sleep duration were the only variables that significantly differed between the napping and non-napping groups. Participants with insomnia were generally older, heavier, and more physically active than those without insomnia. A higher proportion of female than male was found among participants with insomnia. Those with insomnia also had a higher prevalence of MetS, as well as significantly greater proportions of abdominal obesity, high TG, and high BP compared to those without insomnia. Additionally, there was significant variation in the number of participants when categorized by sleep duration.
- Associations of metabolic syndrome with the coexistence of insomnia and napping
- Table 3 shows the associations of MetS with the coexistence of insomnia and napping. Compared to the non-insomnia and non-napping group, the coexistence of insomnia and non-napping had higher ORs for MetS in the crude analysis, but this was no longer significant after controlling for confounding variables.
- Associations of metabolic syndrome components with the coexistence of insomnia and napping
- Next, we conducted a multivariate logistic regression analysis to examine the associations of individual MetS components with the coexistence of insomnia and napping (Table 4). MetS components were significantly associated with different combinations of napping and insomnia. The coexistence of insomnia and napping was significantly associated with higher TG levels compared to the coexistence of non-insomnia and napping (OR, 1.13; 95% CI, 1.00 to 1.29; p= 0.047) and the coexistence of insomnia and non-napping (OR, 1.19; 95% CI, 1.02 to 1.39; p= 0.026). Significant associations were found between the coexistence of insomnia and non-napping and high BP (OR, 1.28; 95% CI, 1.10 to 1.49; p= 0.002). In addition, the coexistence of insomnia and napping was associated with a higher likelihood of elevated FBG (OR, 1.59; 95% CI, 1.14 to 2.21; p= 0.006), compared to the non-insomnia and non-napping. No significant interaction was observed between insomnia and napping in terms of associations with MetS components, although borderline significance was found for high BP.
- Associations of metabolic syndrome with the coexistence of insomnia symptoms and napping
- As shown in Table 5, the combination of DMS and non-napping was associated with a higher OR (OR, 1.28; 95% CI, 1.07 to 1.54; p = 0.009) for MetS compared to the non-DMS and nonnapping group in the crude model. The OR for MetS decreased slightly, but remained significant after adjusting for confounders (OR, 1.25; 95% CI, 1.03 to 1.52; p = 0.023). The coexistence of EMA and non-napping, NRS and non-napping, and NRS and napping had significant positive associations with MetS in the crude analysis, but these associations disappeared after adjusting for confounders.
RESULTS
- This study investigated the associations of the combination of insomnia and napping with MetS or its components in a large, population-based study. While no group defined by the combination of insomnia and napping was associated with MetS as a whole, individuals with insomnia who did not nap exhibited a greater likelihood of having certain MetS components, including high TG and high BP. Specifically, DMS was linked to MetS, particularly in those who did not nap.
- Contradictory results have been reported regarding the effects of daytime napping on CVD. A Greek cohort study [18] reported that daytime napping was linked to a 34% decrease in the risk of death from coronary heart disease. Similarly, another populationbased, prospective cohort study reported a significantly lower risk of incident cardiovascular events for individuals who napped once or twice per week compared to those who did not nap [19]. In contrast, other cohort studies [20-22] and a case-control study [23] have shown an increased risk for heart disease or CVD mortality. A dose-response meta-analysis of 20 cohort studies revealed that longer napping durations (> 60 min/day) were associated with a heightened risk of CVD. This suggests that both the frequency and duration of napping may influence the relationship between daytime napping and CVD risk [24].
- Unlike the conflicting relationships between napping and CVD, relatively consistent findings have been reported regarding the association between napping and metabolic disease. A previous meta-analysis demonstrated a J-shaped association between napping and the risk of metabolism-related diseases [25], and this relationship appears to vary by napping duration, age, sex, and specific metabolic conditions. In a Chinese population-based study, daytime napping for more than 1 hour was independently associated with a higher prevalence of diabetes compared to the nonnapping group, but daytime napping for a half hour or less was associated with a lower prevalence of fatty liver and dyslipidemia only in female aged less than 50 years old [26]. We also observed that individuals without insomnia who napped were more likely to have elevated TG levels. The mechanism underlying these associations between napping and metabolic diseases is still unclear, but possible mediators include evening cortisol elevation [27], sympathetic nervous system activation after napping [28], and disrupted circadian rhythms [29]. Additionally, since napping is directly linked to longer durations spent in bed, it may lead to decreased energy expenditure and an increase in fat deposition, which could also contribute to higher TG levels [30].
- Poor sleep quality, or specific types of sleep complaints, can differentially affect MetS and its components. A recent meta-analysis has shown that poor sleep quality is linked to several components of MetS, including elevated blood pressure, an abnormal lipid profile, and impaired glycemic control [31]. In a cross-sectional study investigating the relationship between insomnia and MetS, insomnia was significantly associated only with low HDL-cholesterol and high serum TG, indicating that dyslipidemia is a primary MetS component influenced by insomnia [8]. Certain symptoms of insomnia may predict the onset of MetS. For instance, in a community-based, 3-year follow-up study, DIS and NRS were significant predictors of MetS development [32]. Another cross-sectional study examining the link between individual insomnia symptoms and MetS found that, of the symptoms, only DMS was significantly associated with MetS, which aligns with our findings [33]. Collectively, both cross-sectional and longitudinal studies have reported a significant association between insomnia and MetS, with an increased risk of developing MetS in individuals with insomnia [6,34,35], and significant relationships have been found between specific insomnia symptoms and components of MetS [5,33,35].
- Previous studies have demonstrated a positive association between napping and abdominal obesity [36,37]. However, our findings did not reveal this relationship, which may be attributed to variations in how napping and obesity are defined, as well as the differences in the confounders that were adjusted for in our analysis. Our findings indicate that a single exposure to either napping or insomnia is associated with elevated TG, while the concurrent presence of both insomnia and napping does not show this association. This observation aligns with prior research that has established a connection between napping or insomnia and an increased risk of cardiovascular and metabolic conditions [38,39].
- The present study also showed that individuals with insomnia, especially those who do not take naps, are more likely to have high BP or elevated TG. Sleep deprivation or poor sleep quality in those with insomnia triggers biological responses, including activation of the hypothalamic-pituitary-adrenal (HPA) axis and the sympathetic nervous system (SNS), as well as inflammation [40-42], all of which can lead to increased BP. Furthermore, a lack of sleep has been linked to changes in appetite-regulating hormones [43] and a heightened desire for carbohydrate-rich foods [44]. Therefore, napping may help individuals with insomnia counteract these biological responses by compensating for lost sleep or poor sleep quality.
- However, we found adverse results for the coexistence of insomnia and napping in association with high FBG. These results are somewhat unexpected, given that napping can reduce the activity of the HPA axis and SNS, which are well-known blood glucose elevators. The timing and frequency of napping, the type of insomnia symptoms, and the presence of uncontrolled confounding variables may influence the synergistic association between the combination of insomnia and napping and high FBG.
- Several limitations should be considered when interpreting the results of this study. First, the study’s cross-sectional design precludes the inference of a causal relationship for the observed associations. Second, the exposure variables, insomnia and daytime napping, were defined based on self-reported questionnaires, which may be less accurate than data obtained from a doctor’s diagnosis or a sleep recording device. Third, given that the components of MetS are interrelated, the results from multiple testing with correlated outcomes require cautious interpretation, even though each component was analyzed in a separate model.
- In summary, this population-based cross-sectional study showed that individuals with insomnia, particularly those who do not nap, are likely to have MetS components, such as TG or BP. Further studies are needed to provide causal inferences regarding the association of coexisting insomnia and napping with MetS and its components.
DISCUSSION
-
Conflict of interest
The authors have no conflicts of interest to declare for this study.
-
Funding
This work was supported by a National Research Foundation of Korea grant funded by the Korean government (NRF-2019R1A2C2084000 and NRF-2021R1I1A3060351).
-
Author contributions
Conceptualization: Lee DB, Baik I. Data curation: Lee DB, Baik I. Formal analysis: Lee DB, Baik I. Funding acquisition: Yoon DW, Baik I. Writing – original draft: Lee DB. Writing – review & editing: Yoon DW, Baik I.
NOTES
ACKNOWLEDGEMENTS

Values are presented as mean±standard deviation or number (%).
BMI, body mass index; MET, metabolic equivalent; DIS, difficulty in initiating sleep; DMS, difficulty in maintaining sleep; EMA, early morning awakening; NRS, non-restorative sleep; MetS, metabolic syndrome; HDL, high-density lipoprotein; OSA, obstructive sleep apnea.
| Group |
Non-insomnia & non-napping |
Non-insomnia & napping |
Insomnia & non-napping |
Insomnia & napping |
p-value for interaction | ||||
|---|---|---|---|---|---|---|---|---|---|
| Case/Non-case | Multivariate OR (95% CI) | Case/Non-case | Multivariate OR (95% CI) | Case/Non-case | Multivariate OR (95% CI) | Case/Non-case | Multivariate OR (95% CI) | ||
| Abdominal obesity (n=3,725)1 | 2,572/3,235 | 1.00 (reference) | 676/826 | 1.13 (0.99, 1.30) | 379/538 | 1.04 (0.88, 1.23) | 98/116 | 1.18 (0.85, 1.63) | 0.992 |
| High TG (n=3,105)2 | 2,080/3,727 | 1.00 (reference) | 576/926 | 1.13 (1.00, 1.29)* | 368/549 | 1.19 (1.02, 1.39)* | 81/133 | 1.06 (0.78, 1.42) | 0.163 |
| Low HDL-c (n=3,162)2 | 2,113/3,694 | 1.00 (reference) | 588/914 | 1.09 (0.96, 1.23) | 378/539 | 1.08 (0.93, 1.26) | 83/131 | 1.00 (0.74, 1.36) | 0.367 |
| High BP (n=3,405)2 | 2,287/3,520 | 1.00 (reference) | 575/927 | 0.94 (0.83, 1.06) | 456/461 | 1.28 (1.10, 1.49)** | 87/127 | 0.87 (0.65, 1.18) | 0.075 |
| High FBG (n=1,486)2 | 986/4,821 | 1.00 (reference) | 270/1,232 | 1.07 (0.92, 1.24) | 176/741 | 1.12 (0.93, 1.35) | 54/160 | 1.59 (1.14, 2.21)** | 0.153 |
OR, odds ratio; CI, confidence interval; TG, triglyceride; HDL-c, high-density lipoprotein-cholesterol; BP, blood pressure; FBG, fasting blood glucose.
1 Data were adjusted for age, sex, smoking status, alcohol consumption status, and the presence of obstructive sleep apnea in case of abdominal obesity.
2 Data were adjusted for age, sex, body mass index, smoking status, alcohol consumption status, and the presence of obstructive sleep apnea in case of high TG, low HDL-c, high BP, and high FBG.
* p<0.05,
** p<0.01.
Data were adjusted for age, sex, body mass index, smoking status, alcohol consumption status, and the presence of obstructive sleep apnea.
MetS, metabolic syndrome; OR, odds ratio; CI, confidence interval; DIS, difficulty in initiating sleep; DMS, difficulty in maintaining sleep; EMA, early morning awakening; NRS, non-restorative sleep.
- 1. Fowler MJ. Microvascular and macrovascular complications of diabetes. Clin Diabetes 2008;26:77-82 https://doi.org/10.2337/diaclin.26.2.77.Article
- 2. Grundy SM, Brewer HB Jr, Cleeman JI, Smith SC Jr, Lenfant C; American Heart Association/National Heart, Lung, and Blood Institute. Definition of metabolic syndrome: report of the National Heart, Lung, and Blood Institute/American Heart Association conference on scientific issues related to definition. Circulation 2004;109:433-438 https://doi.org/10.1161/01.CIR.0000111245.75752.C6.ArticlePubMed
- 3. Grundy SM, Cleeman JI, Daniels SR, Donato KA, Eckel RH, Franklin BA, et al. Diagnosis and management of the metabolic syndrome: an American Heart Association/National Heart, Lung, and Blood Institute scientific statement. Circulation 2005;112:2735-2752 https://doi.org/10.1161/CIRCULATIONAHA.105.169404.ArticlePubMed
- 4. Smiley A, King D, Bidulescu A. The association between sleep duration and metabolic syndrome: the NHANES 2013/2014. Nutrients 2019;11:2582 https://doi.org/10.3390/nu11112582.ArticlePubMedPMC
- 5. Peila R, Xue X, Feliciano EM, Allison M, Sturgeon S, Zaslavsky O, et al. Association of sleep duration and insomnia with metabolic syndrome and its components in the Women’s Health Initiative. BMC Endocr Disord 2022;22:228 https://doi.org/10.1186/s12902-022-01138-9.ArticlePubMedPMC
- 6. Lin SC, Sun CA, You SL, Hwang LC, Liang CY, Yang T, et al. The link of self-reported insomnia symptoms and sleep duration with metabolic syndrome: a Chinese population-based study. Sleep 2016;39:1261-1266 https://doi.org/10.5665/sleep.5848.ArticlePubMedPMC
- 7. Wang Y, Jiang T, Wang X, Zhao J, Kang J, Chen M, et al. Association between insomnia and metabolic syndrome in a Chinese Han population: a cross-sectional study. Sci Rep 2017;7:10893 https://doi.org/10.1038/s41598-017-11431-6.ArticlePubMedPMC
- 8. Zou D, Wennman H, Hedner J, Ekblom Ö, Drotz O, Arvidsson D, et al. Insomnia is associated with metabolic syndrome in a middle-aged population: the SCAPIS pilot cohort. Eur J Prev Cardiol 2021;28:e26-e28 https://doi.org/10.1177/2047487320940862.Article
- 9. Lin D, Sun K, Li F, Qi Y, Ren M, Huang C, et al. Association between habitual daytime napping and metabolic syndrome: a population-based study. Metabolism 2014;63:1520-1527 https://doi.org/10.1016/j.metabol.2014.08.005.ArticlePubMed
- 10. Li W, Kondracki AJ, Sun N, Gautam P, Kalan ME, Jebai R, et al. Nighttime sleep duration, daytime napping, and metabolic syndrome: findings from the China Health and Retirement Longitudinal Study. Sleep Breath 2022;26:1427-1435 https://doi.org/10.1007/s11325-021-02487-w.ArticlePubMed
- 11. Saitoh K, Yoshiike T, Kaneko Y, Utsumi T, Matsui K, Nagao K, et al. The effect of nonrestorative sleep on incident hypertension 1-2 years later among middle-aged Hispanics/Latinos. BMC Public Health 2023;23:1456 https://doi.org/10.1186/s12889-023-16368-2.ArticlePubMedPMC
- 12. Xu Z, Chang Y, Guo F, Wang C, Chai N, Zheng M, et al. The restoration ability of a short nap after sleep deprivation on the brain cognitive function: a dynamic functional connectivity analysis. CNS Neurosci Ther 2024;30:e14413. https://doi.org/10.1111/cns.14413.ArticlePubMedPMC
- 13. Xu N, Wu Q, Ma L, Yu B. Can afternoon napping protect against the negative effect of short or long sleep duration on cognitive function? A prospective study. Sleep Med 2023;102:1-8 https://doi.org/10.1016/j.sleep.2022.12.012.ArticlePubMed
- 14. Baik I, Cho NH, Kim SH, Han BG, Shin C. Genome-wide association studies identify genetic loci related to alcohol consumption in Korean men. Am J Clin Nutr 2011;93:809-816 https://doi.org/10.3945/ajcn.110.001776.ArticlePubMed
- 15. Kim Y, Han BG; KoGES group. Cohort profile: the Korean Genome and Epidemiology Study (KoGES) consortium. Int J Epidemiol 2017;46:1350 https://doi.org/10.1093/ije/dyx105.ArticlePubMedPMC
- 16. Ghazizadeh H, Mobarra N, Esmaily H, Seyedi SM, Amiri A, Rezaeitalab F, et al. The association between daily naps and metabolic syndrome: evidence from a population-based study in the Middle-East. Sleep Health 2020;6:684-689 https://doi.org/10.1016/j.sleh.2020.03.007.ArticlePubMed
- 17. Expert Panel on Detection, Evaluation, and Treatment of High Blood Cholesterol in Adults. Executive summary of the third report of the National Cholesterol Education Program (NCEP) expert panel on detection, evaluation, and treatment of high blood cholesterol in adults (adult treatment panel III). JAMA 2001;285:2486-2497 https://doi.org/10.1001/jama.285.19.2486.ArticlePubMed
- 18. Naska A, Oikonomou E, Trichopoulou A, Psaltopoulou T, Trichopoulos D. Siesta in healthy adults and coronary mortality in the general population. Arch Intern Med 2007;167:296-301 https://doi.org/10.1001/archinte.167.3.296.ArticlePubMed
- 19. Häusler N, Haba-Rubio J, Heinzer R, Marques-Vidal P. Association of napping with incident cardiovascular events in a prospective cohort study. Heart 2019;105:1793-1798 https://doi.org/10.1136/heartjnl-2019-314999.ArticlePubMed
- 20. Stang A, Dragano N, Moebus S, Möhlenkamp S, Schmermund A, Kälsch H, et al. Midday naps and the risk of coronary artery disease: results of the Heinz Nixdorf Recall Study. Sleep 2012;35:1705-1712 https://doi.org/10.5665/sleep.2248.ArticlePubMedPMC
- 21. Stone KL, Ewing SK, Ancoli-Israel S, Ensrud KE, Redline S, Bauer DC, et al. Self-reported sleep and nap habits and risk of mortality in a large cohort of older women. J Am Geriatr Soc 2009;57:604-611 https://doi.org/10.1111/j.1532-5415.2008.02171.x.ArticlePubMedPMC
- 22. Tanabe N, Iso H, Seki N, Suzuki H, Yatsuya H, Toyoshima H, et al. Daytime napping and mortality, with a special reference to cardiovascular disease: the JACC study. Int J Epidemiol 2010;39:233-243 https://doi.org/10.1093/ije/dyp327.ArticlePubMed
- 23. Campos H, Siles X. Siesta and the risk of coronary heart disease: results from a population-based, case-control study in Costa Rica. Int J Epidemiol 2000;29:429-437 https://doi.org/10.1093/ije/29.3.429.ArticlePubMed
- 24. Pan Z, Huang M, Huang J, Yao Z, Lin Z. Association of napping and all-cause mortality and incident cardiovascular diseases: a dose-response meta analysis of cohort studies. Sleep Med 2020;74:165-172 https://doi.org/10.1016/j.sleep.2020.08.009.ArticlePubMed
- 25. Yamada T, Shojima N, Yamauchi T, Kadowaki T. J-curve relation between daytime nap duration and type 2 diabetes or metabolic syndrome: a dose-response meta-analysis. Sci Rep 2016;6:38075 https://doi.org/10.1038/srep38075.ArticlePubMedPMC
- 26. Zhao X, Cheng L, Zhu C, Cen S, Lin W, Zheng W, et al. A double-edged sword: the association of daytime napping duration and metabolism related diseases in a Chinese population. Eur J Clin Nutr 2021;75:291-298 https://doi.org/10.1038/s41430-020-00777-2.ArticlePubMed
- 27. Woods DL, Kim H, Yefimova M. To nap or not to nap: excessive daytime napping is associated with elevated evening cortisol in nursing home residents with dementia. Biol Res Nurs 2013;15:185-190 https://doi.org/10.1177/1099800411420861.ArticlePubMed
- 28. Davy KP, Orr JS. Sympathetic nervous system behavior in human obesity. Neurosci Biobehav Rev 2009;33:116-124 https://doi.org/10.1016/j.neubiorev.2008.05.024.ArticlePubMedPMC
- 29. Shi SQ, Ansari TS, McGuinness OP, Wasserman DH, Johnson CH. Circadian disruption leads to insulin resistance and obesity. Curr Biol 2013;23:372-381 https://doi.org/10.1016/j.cub.2013.01.048.ArticlePubMedPMC
- 30. Lucassen EA, Rother KI, Cizza G. Interacting epidemics? Sleep curtailment, insulin resistance, and obesity. Ann N Y Acad Sci 2012;1264:110-134 https://doi.org/10.1111/j.1749-6632.2012.06655.x.ArticlePubMedPMC
- 31. Lian Y, Yuan Q, Wang G, Tang F. Association between sleep quality and metabolic syndrome: a systematic review and meta-analysis. Psychiatry Res 2019;274:66-74 https://doi.org/10.1016/j.psychres.2019.01.096.ArticlePubMed
- 32. Troxel WM, Buysse DJ, Matthews KA, Kip KE, Strollo PJ, Hall M, et al. Sleep symptoms predict the development of the metabolic syndrome. Sleep 2010;33:1633-1640 https://doi.org/10.1093/sleep/33.12.1633.ArticlePubMedPMC
- 33. Akbaraly TN, Jaussent I, Besset A, Bertrand M, Barberger-Gateau P, Ritchie K, et al. Sleep complaints and metabolic syndrome in an elderly population: the Three-City Study. Am J Geriatr Psychiatry 2015;23:818-828 https://doi.org/10.1016/j.jagp.2014.10.001.ArticlePubMed
- 34. Bastien CH, Vallières A, Morin CM. Validation of the Insomnia Severity Index as an outcome measure for insomnia research. Sleep Med 2001;2:297-307 https://doi.org/10.1016/S1389-9457(00)00065-4.ArticlePubMed
- 35. Garbarino S, Magnavita N. Sleep problems are a strong predictor of stress-related metabolic changes in police officers. A prospective study. PLoS One 2019;14:e0224259. https://doi.org/10.1371/journal.pone.0224259.ArticlePubMedPMC
- 36. Loredo JS, Weng J, Ramos AR, Sotres-Alvarez D, Simonelli G, Talavera GA, et al. Sleep patterns and obesity: Hispanic community health study/study of Latinos Sueño Ancillar study. Chest 2019;156:348-356 https://doi.org/10.1016/j.chest.2018.12.004.ArticlePubMedPMC
- 37. Wang N, Zou J, Fang S, Zhou J. Association between daytime napping and obesity in Chinese middle-aged and older adults. J Glob Health 2020;10:020804 https://doi.org/10.7189/jogh.10.020804.ArticlePubMedPMC
- 38. Cai H, Su N, Li W, Li X, Xiao S, Sun L. Relationship between afternoon napping and cognitive function in the ageing Chinese population. Gen Psychiatr 2021;34:e100361. https://doi.org/10.1136/gpsych-2020-100361.ArticlePubMedPMC
- 39. Hsu YW, Chang CP. Stress of life events and anxiety as mediators of the association between insomnia and triglycerides in college students. J Am Coll Health 2022;70:1396-1402 https://doi.org/10.1080/07448481.2020.1799805.ArticlePubMed
- 40. van Dalfsen JH, Markus CR. The influence of sleep on human hypothalamic-pituitary-adrenal (HPA) axis reactivity: a systematic review. Sleep Med Rev 2018;39:187-194 https://doi.org/10.1016/j.smrv.2017.10.002.ArticlePubMed
- 41. Khovidhunkit W, Kim MS, Memon RA, Shigenaga JK, Moser AH, Feingold KR, et al. Effects of infection and inflammation on lipid and lipoprotein metabolism: mechanisms and consequences to the host. J Lipid Res 2004;45:1169-1196 https://doi.org/10.1194/jlr.R300019-JLR200.ArticlePubMed
- 42. Piber D, Cho JH, Lee O, Lamkin DM, Olmstead R, Irwin MR. Sleep disturbance and activation of cellular and transcriptional mechanisms of inflammation in older adults. Brain Behav Immun 2022;106:67-75 https://doi.org/10.1016/j.bbi.2022.08.004.ArticlePubMed
- 43. Spiegel K, Tasali E, Penev P, Van Cauter E. Brief communication: sleep curtailment in healthy young men is associated with decreased leptin levels, elevated ghrelin levels, and increased hunger and appetite. Ann Intern Med 2004;141:846-850 https://doi.org/10.7326/0003-4819-141-11-200412070-00008.ArticlePubMed
- 44. Taheri S, Lin L, Austin D, Young T, Mignot E. Short sleep duration is associated with reduced leptin, elevated ghrelin, and increased body mass index. PLoS Med 2004;1:e62. https://doi.org/10.1371/journal.pmed.0010062.ArticlePubMedPMC
REFERENCES
Figure & Data
References
Citations
 PubReader
 ePub Link
 Cite
Cite- Figure
-
- Related articles
-
- Nutrition survey methods and food composition database update of the Korean Genome and Epidemiology Study
- Socioeconomic inequalities in metabolic syndrome and its components in a sample of Iranian Kurdish adults
- Association of group-level segregation with cardiovascular health in older adults: an analysis of data from the Korean Social Life, Health, and Aging Project
- The relationship between metabolic syndrome and its components with bladder cancer: a systematic review and meta-analysis of cohort studies

