Warning: fopen(/home/virtual/epih/journal/upload/ip_log/ip_log_2024-12.txt): failed to open stream: Permission denied in /home/virtual/lib/view_data.php on line 95 Warning: fwrite() expects parameter 1 to be resource, boolean given in /home/virtual/lib/view_data.php on line 96 Cardiovascular Risk Factors for Incident Hypertension in the Prehypertensive Population
Skip Navigation
Skip to contents

Epidemiol Health : Epidemiology and Health

OPEN ACCESS
SEARCH
Search

Articles

Page Path
HOME > Epidemiol Health > Volume 32; 2010 > Article
Original Article
Cardiovascular Risk Factors for Incident Hypertension in the Prehypertensive Population
Soo Jeong Kim1, Jakyoung Lee2, Sun Ha Jee2,3, Chung Mo Nam4, Kihong Chun5, Il Soo Park6, Soon Young Lee5
Epidemiol Health 2010;32:e2010003.
DOI: https://doi.org/10.4178/epih/e2010003
Published online: May 1, 2010

1Department of Occupational and Environmental Medicine, Ajou University School of Medicine, Suwon, Korea.

2Graduate School of Public Health, Yonsei University, Seoul, Korea.

3Institute for Health Promotion, Yonsei University, Seoul, Korea.

4Department of Preventive Medicine, Yonsei University College of Medicine, Seoul, Korea.

5Department of Preventive Medicine and Public Health, Ajou University School of Medicine, Suwon, Korea.

6National Health Insurance Corporation, Seoul, Korea.

Correspondence: Soon Young Lee, MD, PhD. Department of Preventive Medicine and Public Health, Ajou University School of Medicine, San 5 Wonchon-dong, Yeongtong-gu, Suwon 443-721, Korea. Tel: +82-31-219-5301 Fax: +82-31-219-5084, solee@ajou.ac.kr
• Received: December 9, 2009   • Accepted: February 1, 2010

Copyright © 2010 Korean Society of Epidemiology

This is an open-access article distributed under the terms of the Creative Commons Attribution License (http://creativecommons.org/licenses/by/3.0/), which permits unrestricted use, distribution, and reproduction in any medium, provided the original work is properly cited.

prev next
  • 20,550 Views
  • 133 Download
  • 20 Crossref
  • OBJECTIVES
    The aim of this study was to investigate the effect of changes in cardiovascular disease (CVD) risk factors on progression from prehypertension (PreHTN) to hypertension (HTN) using an 8-yr prospective Korean Cancer Prevention Study (KCPS) by the National Health Insurance Corporation (NHIC) in Korea.
  • METHODS
    A total of 16,229 subjects, aged 30 to 54, with new onset preHTN at baseline (1994-1996) in a biennial national medical exam were selected and followed up till 2004 at 2-yr intervals. All subjects underwent a biennial health examination including biochemical measurements and behavior. The log-rank test was performed to assess the relationship between changes in CVD risk factors and progression to HTN. The Cox proportional hazard model was used to identify factors influencing progression to HTN.
  • RESULTS
    With regards the progression rate in men, ex-smokers (42.9%), abstainers (37.5%), and regular exercisers (37.6%) showed a slower progression rate than continuous smokers (49.5%) and continuous drinkers (50.9%). In women, those who participated in regular exercise (22.6%) had a lower rate of progression than continuous non-exercisers (36.1%). According to the results of the Cox proportional hazard model, improvements in smoking (hazard ratio [HR], 0.756), drinking (HR, 0.669), regular exercise (HR, 0.653), body mass index (HR, 0.715), and total cholesterol (HR, 0.788) played a protective role in progression to HTN in men, while in women, participating in regular exercise (HR, 0.534) was beneficial.
  • CONCLUSION
    Improvements in CVD-related behaviors diminished the progression rate of HTN. This study suggests that individuals with PreHTN should be targeted for specific health behavioral intervention to prevent the progression of HTN.
Hypertension (HTN) is defined as a repeatedly elevated blood pressure (BP) exceeding a systolic blood pressure (SBP) over 140 mmHg and/or a diastolic blood pressure (DBP) over 90 mmHg [1]. It is clear that HTN has become a worldwide epidemic and an important risk factor of cardiovascular disease (CVD), which might cause fatal results in an individual such as stroke, myocardial infarction, ischemic heart disease, kidney disease, and peripheral vascular disease [1-4]. Revised reports have been published every four or five years since the Joint National Committee (JNC) on Prevention, Detection, Evaluation, and Treatment of High Blood Pressure was first established in 1977 [5]. In the recent JNC-7 report, a new category known as prehypertension (PreHTN) was added. In this category, the normal and high-normal BP of the JNC-6 criteria are combined because even normal BP (SBP 120 to 129 mmHg or DBP 80 to 84 mmHg) are potentially related to future CVD. Several studies have investigated the short-term and long-term progression rates from the non-hypertensive category to HTN [6-12]. According to the Framingham Heart Study, at the age of 55 yr, prehypertensive people had a two times higher risk of progression to HTN than normotensive people [8]. Many studies have suggested that lifestyle modifications might help people to manage HTN [6, 9, 10, 13]. Researchers have been interested in behavioral changes such as exercise, a healthy diet, smoking cessation, etc. For example, a follow-up of the data from the British Health and Lifestyle Surveys for 7 yr showed that the relative risk (RR) (95% confidence intervals, CI) of subjects who were overweight at follow-up but not at baseline was 1.65 (1.33-2.14) and that the RR of subjects who were overweight at baseline but not at follow-up was 0.58 (0.34-1.01) compared with those who were not overweight at baseline or follow-up. Those who were smokers at follow-up had a higher risk (RR, 95% CI: 1.12, 0.94-1.34) of HTN than those who were non-smokers at baseline or follow-up [9]. However, there have been few studies on the association between CVD risk factors and the progression of HTN among people with PreHTN in Korea. The purpose of this study was thus to examine factors influencing progression using a prospective cohort dataset, the Korean Cancer Prevention Study (KCPS) from the National Health Insurance Corporation (NHIC).
Study population
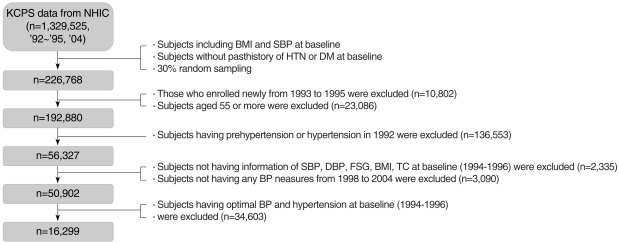
NHIC provides a national health insurance program for government employees, private school teachers and their dependents. The NHIC data include the KCPS data from 1,329,525 Koreans between the ages of 30 and 95 yr who underwent biennial medical evaluations. A total of 784,870 (59.0%) were enrolled in 1992, 367,903 (27.7%) in 1993, 98,417 (7.4%) in 1994, and 78,335 (5.9%) in 1995. A more detailed description of the subjects can be found elsewhere [14, 15]. In the present study, after randomly selecting 30% of the subjects from the KCPS data, various exclusion processes were carried out (Figure 1). The baseline data were collected in 1994 and 1996. The data from participants were examined at baseline and at follow-up health examinations in 1998, 2000, 2002, and 2004. The study included examinees who underwent the biennial health examination at least once or more over the period of 8 yr. Participants were excluded if they had PreHTN or HTN in 1992. The final sample consisted of 16,299 subjects with PreHTN at baseline (1994-1996) who were followed every other year until 2004. The study protocol was approved by the Yonsei University College of Medicine ethical committee.
BP measurements
The BP of participants was measured by registered nurses or trained technicians using a standard mercury sphygmomanometer or an automatic manometer. We used the mean BP of 1994 and 1996 to minimize misclassification error. The measured BP was classified as optimal (SBP <120 mmHg and DBP <80 mmHg), normal (SBP 120 to 129 mmHg or DBP 80 to 84 mmHg), high-normal (SBP 130-139 mmHg or DBP 85 to 89 mmHg), or HTN (SBP ≥140 mmHg or DBP ≥90 mmHg) based on JNC-6 criteria.
Other measurements
Subjects were asked about their health behaviors and underwent biochemical measurements in each biennial health examination from 1992 to 2004. The health behavior characteristics included smoking, drinking, regular exercise and their family history of CVD-related diseases. Baseline data such as age and a family history of CVDs were based on the records from 1992. For smoking habits, the question asked was how many cigarettes he/she smoked. The respondents had the option of recording their current smoking status as never-smoker, ex-smoker or current smoker. Subjects were asked about their smoking habit status at each assessment to determine changes in smoking status. For drinking habits, the question asked was what are his/her drinking habits. The options were either "don't drink," "drink sometimes" or "drink often". Subjects were categorized into either non-drinker or current drinker (drinking sometimes and drinking often). Subjects were also asked whether they had changed their drinking status at the subsequent measurements. For regular exercise, the question asked was whether he/she was involved in regular exercise. The respondents replied either "yes" or "no" to the question. Subjects were classified into either those taking regular exercise or those not doing regular exercise. The information on smoking, drinking, and regular exercise at baseline was either from the data recorded in 1994 if available, or in 1996. For the biochemical measurements, the body mass index (BMI), serum glucose and total cholesterol were measured after fasting. The mean value of the 1994 and 1996 measurements for BMI, fasting serum glucose (FSG), and total serum cholesterol (TC) was used as the baseline. Changes in health habits and co-morbidity information were defined as any change between the data from 1994 or 1996 and the last follow-up data from 1998, 2000, 2002, and 2004.
Statistical methods
The t-test and χ2-test were used to investigate the baseline characteristics of the study population according to the baseline BP. To assess the relationship between changes in CVD risk factors and progression to HTN, the log-rank test was performed. HRs and 95% CI were obtained by the Cox proportional hazard model to determine the impact of changes in CVD risk factors on progression to HTN. All statistical analyses were conducted using SAS version 9.1.3 (SAS Institute Inc., Cary, NC, USA).
Baseline characteristics of the study population according to baseline blood pressure
Table 1 shows the general characteristics of the study population according to baseline BP. The two groups (normal BP, and high-normal BP) differed significantly in all characteristics, except for the family history of CVD. The mean age was 38.6 yr for the normal BP group, and 39.8 yr for the high-normal BP group, respectively (p<0.0001). The high-normal group showed a significantly higher percentage of smoking, alcohol drinking and regular physical activity than the normal group. The high-normal group had an elevated mean SBP, DBP, FSG, and TC compared with the normal group (p<0.0001).
Association between changes in cardiovascular disease risk factors and progression from prehypertension to hypertension
Tables 2, 3 summarize the results regarding the association between the changes in CVD risk factors and the progression rate in men and women. In men, the ex-smoker group (42.9%) showed a slower rate of progression compared to the continuous smoker group (49.5%) and the non-smoker group at baseline and the current smoker group at follow-up (51.0%). The progression rate in the continuously drinking group was found to be 50.9%, whereas that of the sober group stood at 37.5%; the rate in the non-drinking group at baseline and the drinking group at follow-up was 39.1%. Those participating in regular exercise had a slower rate of progression (37.6%) than that in those who did not take regular exercise (49.6%) and that in regular exercisers at baseline and non-regular exercisers at follow-up (49.3%). The consistently obese group showed a progression rate of 58.2% while the group in which weight fluctuated (normal weight to overweight and vice versa) demonstrated a 45.0% progression rate, resulting in a 13.2% difference. In terms of FSG measurements, the group with consistently normal FSG showed the lowest progression rate (47.3%). Unlike other CVD risk factors, the group with high FSG at baseline and normal FSG at follow-up (55.3%) and the group with normal FSG at baseline and high FSG at follow-up (52.1%) had a slower rate of progression than the consistently high FSG group (51.2%). In terms of TC measurements, the group with improvements in TC demonstrated lower progression rates than the consistently high TC group (Table 2). In women, smoking was excluded from the analyses due to the extremely low current smoking rate. The progression rate in the continuously drinking group was 38.7%, whereas that of the sober group stood at 36.2% and the non-drinking group at baseline and drinking group at follow-up at 31.7%. The group that changed from non-exercise to exercise showed the lowest progression rate (22.6%). In terms of FSG measurements, the continuously normal FSG group showed the lowest progression rate (34.9%), and the continuously high FSG group showed the highest progression rate (86.7%). With regards TC measurements, the group with improvements in TC (42.3%) had a lower progression rate than the consistently HTC group (48.4%) (Table 3).
The HRs of progression to HTN are shown by age, family history of CVD, changes in health behavior factors (smoking, alcohol drinking, regular exercise), and changes in comorbidities (BMI, FSG, TC) in prehypertensive subjects at baseline (Table 4). With advanced age, the progression to HTN was accelerated. In addition, compared to the group without a family history of CVD, men with such a background showed about a 1.146 times higher risk of contracting HTN. Improvements in CVD risk factors were also closely associated with a decreased risk of progression to HTN. Improvements in health behaviors and co-morbidities significantly diminished the risk of HTN from 1.269 to 1.531 times in men. In women, smoking was excluded from analyses due to the extremely small size of the sample. Unlike in men, subjects taking regular exercise reduced their probability of HTN by 1.873 times (95% CI: 0.426-0.669).
To our knowledge, this is the first investigation of the relationship between changes in CVD risk factors and the rate of progression of HTN using national longitudinal data in Korea. These longitudinal data showed that improvements in CVD risk factors diminished the rate of progression of HTN in prehypertensive men and women. The periodic screening of BP in adults has been recommended to detect the onset of HTN [3, 16] so that appropriate measures can be taken to prevent the morbidity and mortality associated with raised BP [17]. The European Task Force on Prevention of Coronary Disease recommended a follow-up interval of up to 5 yr [18]. Current recommendations for follow-up BP screening of individuals without HTN are empirical rather than evidence-based, and vary widely [16, 18].
It has previously been reported that older age, higher BMI, and elevated baseline BP are independent risk factors for future HTN [3, 19, 20]. Recent reports from the Framingham Heart Study suggested that persons with normal BP at 55 years of age had a 90% lifetime risk of developing HTN [3, 21]. An increasing incidence of HTN with increasing age was found, which was in line with other results [11, 22]. Cigarette smoking is well established as a causal factor in coronary heart disease and stroke. According to the Korea Medical Insurance Corporation (KMIC) study, smoking is also a major independent risk factor for ischemic heart disease (IHD), CVD, and atherosclerotic cardiovascular disease (ASCVD). The RR from current smoking was reported to be 3.3 (95% CI: 1.7-6.2) for IHD and 1.6 (95% CI: 1.2-2.3) for CVD [23]. In the Cox proportional hazard model, the HR (95% CI) of ex-smokers was 0.756 (0.696-0.821) in men, compared with continuous smokers among the current smokers at baseline. Heavy alcohol consumption may cause other cardiac disorders and is associated with an increased risk of stroke [24]. The HR (95% CI) of non-drinkers was 0.669 (0.607-0.738) in men and 0.829 (0.613-1.121) in women, respectively, compared with continuous drinkers. In general, regular exercise reduces the risk of coronary artery disesase (CHD). Regular exercise has BP-lowering effects [25]. It was reported that individuals participating in 20 min of light or moderate regular exercise every day had about a 30% lower risk of death from CHD than sedentary individuals [26]. In this study, in those not taking regular exercise at baseline, the HR (95% CI) of subjects who later started regular exercise was 0.653 (0.593-0.718) in men and 0.534 (0.426-0.669) in women, compared with those not participating in regular exercise at all. Obesity contributes to elevated BP [17]. It has consistently been proven through clinical trials that reducing weight can lower SBP and DBP [27]. The risk of HTN is higher among obese people (BMI ≥25 kg/m2). The BMI is significantly and positively correlated with both SBP and DBP [28]. Jee et al. [15] found that underweight, overweight and obese men and women had higher rates of death than normal weight men and women. Several previous studies have reported that weight loss might play a protective role in the progression to HTN [9, 29, 30]. In this study, the HR (95% CI) of the weight loss group (BMI <25 kg/m2) was 0.715 (0.593-0.861) in men and 0.634 (0.401-1.001) in women, compared with the continuously obese group (BMI ≥25 kg/m2). Kim et al. [11] reported that diabetes mellitus (DM) was an independent risk factor for HTN in women, but not men. In this study, the baseline FSG level was associated with the progression of HTN in both men and women. However, lowering the FSG did not play a protective role in the progression to HTN in either men or women. In previous studies, a higher TC was a predictor of progression to HTN [30]. In another study, the direct and progressive relationship between TC and CVD was reported [31]. In this study, TC was a strong predictor of the progression to HTN. Compared to the consistently high TC group (TC ≥240 mg/dL), the 'back to normal' TC group (TC <240 mg/dL) lowered their risk by 1.27 times in men, controlling for other CVD risk factors.
This study has several potential limitations. First, there was no information on antihypertensive medications in this population, which could be a confounding factor in the association between the CVD risk factors and BP. The absence of medication information could have resulted in a conservative estimate of the incidence of PreHTN and HTN. Second, misclassification bias could have arisen from measurement error because the biennial health examinations were carried out at various hospitals throughout the country and the laboratory techniques varied. However, the data collected were subject to internal and external quality control [32, 33]. Third, we categorized the individuals based on the average BP in 1994 and 1995 obtained from a single BP measurement, as in the recent study by Hansen et al. [34], while other studies used two readings [2]. Lastly, since we used data from biennial BP measurements, we had no information on possible changes during the intervening period. It is possible that individuals with HTN changed their unhealthy lifestyles. For example, when a current smoker was diagnosed with PreHTN at the first examination, she/he may have subsequently quit smoking. After stopping smoking, BP could have returned to normal. We are not in a position to know whether smoking cessation alone contributed to decreasing BP.
Despite several limitations, this study has a few strengths, including the extensive coverage of South Koreans with repeated measures of BP, FSG, TC, weight, and height through the KCPS data. This large sample size and the prospective design had sufficient statistical power in general, even in subgroup and dose-response analyses [23, 35].
In conclusion, this study confirmed the findings of previous studies demonstrating a relationship between changes in CVD risk factors and the progression from PreHTN to HTN. With regards public health implications in Korea, the prehypertensive population should be targeted for specific health intervention to change their unhealthy lifestyles. Large intervention studies should be established urgently in order to confirm the results of this study.
We are indebted to the staff of the Korean National Health Insurance Corporation. This study was supported by a grant from the Seoul R&BD Program, Republic of Korea (10526).

No author has a commercial or other association that might pose a conflict of interest.

This article is available from: http://e-epih.org/

  • 1. World Health Organization. 1993 guidelines for the management of mild hypertension: memorandum from a World Health Organization/international society of hypertension meeting. Guidelines Subcommittee. J Hypertens 1993;11:905-918. 8254173.PubMed
  • 2. Vasan RS, Larson MG, Leip EP, Evans JC, O'Donnell CJ, Kannel WB, et al. Impact of high-normal blood pressure on the risk of cardiovascular disease. N Engl J Med 2001;345:1291-1297. 11794147.ArticlePubMed
  • 3. Chobanian AV, Bakris GL, Black HR, Cushman WC, Green LA, Izzo JL Jr, et al. The Seventh Report of the Joint National Committee on Prevention, Detection, Evaluation, and Treatment of High Blood Pressure: the JNC 7 report. JAMA 2003;289:2560-2572. 12748199.ArticlePubMed
  • 4. Erdine S, Ari O, Zanchetti A, Cifkova R, Fagard R, Kjeldsen S, et al. ESH-ESC guideline for the management of hypertension. Herz 2006;31:331-338. 16810473.ArticlePubMed
  • 5. Moser M. Detection, evaluation, and treatment of high blood pressure. N Y State J Med 1977;77:1753-1758. 268506.ArticlePubMed
  • 6. Leitschuh M, Cupples LA, Kannel W, Gagnon D, Chobanian A. High-normal blood pressure progression to hypertension in the Framingham Heart Study. Hypertension 1991;17:22-27. 1986979.ArticlePubMed
  • 7. Sagie A, Larson MG, Levy D. The natural history of borderline isolated systolic hypertension. N Engl J Med 1993;329:1912-1917. 8247055.ArticlePubMed
  • 8. Vasan RS, Larson MG, Leip EP, Kannel WB, Levy D. Assessment of frequency of progression to hypertension in non-hypertensive participants in the Framingham Heart Study: a cohort study. Lancet 2001;358:1682-1686. 11728544.ArticlePubMed
  • 9. Winegarden CR. From "prehypertension" to hypertension?: Additional evidence. Ann Epidemiol 2005;15:720-725. 15921930.ArticlePubMed
  • 10. Zhang H, Thijs L, Kuznetsova T, Fagard RH, Li X, Staessen JA. Progression to hypertension in the non-hypertensive participants in the Flemish Study on Environment, Genes and Health Outcomes. J Hypertens 2006;24:1719-1727. 16915020.ArticlePubMed
  • 11. Kim J, Kim E, Yi H, Joo S, Shin K, Kim J, et al. Short-term incidence rate of hypertension in Korea middle-aged adults. J Hypertens 2006;24:2177-2182. 17053538.ArticlePubMed
  • 12. Chien KL, Hsu HC, Sung FC, Su TC, Chen MF, Lee YT. Incidence of hypertension and risk of cardiovascular events among ethnic Chinese: report from a community-based cohort study in Taiwan. J Hypertens 2007;25:1355-1361. 17563555.ArticlePubMed
  • 13. Lee JH, Hwang SY, Kim EJ, Kim MJ. Comparison of Risk factors between prehypertension and hypertension in Korean male industrial workers. Public Health Nurs 2006;23(4):314-323. 16817802.ArticlePubMed
  • 14. Jee SH, Samet JM, Ohrr H, Kim JH, Kim IS. Smoking and cancer risk in Korean men and women. Cancer Causes Control 2004;15:341-348. 15141135.ArticlePubMed
  • 15. Jee SH, Sull JW, Park J, Lee SY, Ohrr H, Guallar E, et al. Body-mass index and mortality in Korean men and women. N Engl J Med 2006;355:779-787. 16926276.ArticlePubMed
  • 16. The sixth report of the Joint National Committee on prevention, detection, evaluation, and treatment of high blood pressure. Arch Intern med 1997;157:2413-2446. 9385294.ArticlePubMed
  • 17. Stamler J, Stamler R, Neaton JD. Blood pressure, systolic and diastolic, and cardiovascular risks. US population data. Arch Intern Med 1993;153:598-615. 8439223.ArticlePubMed
  • 18. Wood D, De Backer G, Faergeman O, Graham I, Mancia G, Pyörälä K. Prevention of coronary heart disease in clinical practice. Summary of recommendations of the Second Joint Task Force of European and other Societies on Coronary Prevention. J Hypertens 1998;16:1407-1414. 9814610.ArticlePubMed
  • 19. Whelton PK, He J, Appel LJ, Cutler JA, Havas S, Kotchen TA, et al. Primary prevention of hypertension: clinical and public health advisory from The National High Blood Pressure Education Program. JAMA 2002;288:1882-1888. 12377087.ArticlePubMed
  • 20. Lee JS, Kawakubu K, Kashihara H, Mori K. Effect of long-term body weight change on the incidence of hypertension in Japanese men and women. Int J Obes Relat Metab Disord 2004;28:391-395. 14724660.ArticlePubMed
  • 21. Vasan RS, Beiser A, Seshadri S, Larson MG, Kannel WB, D'Agostino RB, et al. Residual lifetime risk for developing hypertension in middle-aged women and men: The Framingham Heart Study. JAMA 2002;287:1003-1010. 11866648.ArticlePubMed
  • 22. Jee SH, Appel LJ, Suh I, Whelton PK, Kim IS. Prevalence of cardiovascular risk factors in South Korean adults: results from the Korea Medical Insurance Corporation (KMIC) Study. Ann Epidemiol 1998;8:14-21. 9465989.ArticlePubMed
  • 23. Jee SH, Suh I, Kim IS, Appel LJ. Smoking and atherosclerotic cardiovascular disease in men with low levels of serum cholesterol: the Korea Medical Insurance Corporation Study. JAMA 1999;282:2149-2155. 10591337.ArticlePubMed
  • 24. Wannamethee SG, Shaper AG. Patterns of alcohol intake and risk of stroke in middle-aged British men. Stroke 1996;27:1033-1039. 8650710.ArticlePubMed
  • 25. Arakawa K. Effect of exercise on hypertension and associated complications. Hypertens Res 1996;19:S87-S91. 9240772.ArticlePubMed
  • 26. Leon AS, Myers MJ, Connett J. Leisure time physical activity and the 16-year risks of mortality from coronary heart disease and all-causes in the Multiple Risk Factor Intervention Trial (MRFIT). Int J Sports Med 1997;18:S208-S215. 9272851.ArticlePubMed
  • 27. The effects of nonphamacologic interventions on blood pressure of persons with high normal levels. Results of the Trials of Hypertension Prevention, Phase 1. JAMA 1992;267:1213-1220. 1586398.ArticlePubMed
  • 28. Tesfaye F, Nawi NG, Van Minh H, Byass P, Berhane Y, Bonita R, et al. Association between body mass index and blood pressure across three populations in Africa and Asia. J Hum Hypertens 2007;21:28-37. 17066088.ArticlePubMed
  • 29. Franklin SS, Pio JR, Wong ND, Larson MG, Leip EP, Vasan RS, et al. Predictors of new-onset diastolic and systolic hypertension: the Framingham Heart Study. Circulation 2005;111:1121-1127. 15723980.ArticlePubMed
  • 30. de Simone G, Devereux RB, Chinali M, Roman MJ, Best LG, Welty TK, et al. Risk factors for arterial hypertension in adults with initial optimal blood pressure: the Strong Heart Study. Hypertension 2006;47:162-167. 16380527.ArticlePubMed
  • 31. Neaton JD, Wentworth D. Multiple Risk Factor Intervention Trial Research Group. Serum cholesterol, blood pressure, cigarette smoking, and death from coronary heart disease. Overall findings and difference by age for 316,099 white men. Arch Intern Med 1992;152:56-64. 1728930.ArticlePubMed
  • 32. Chung RM, Kim SH, Kim YS, Kim YK, Kim JQ, Yi KN, et al. Annual report on external quality assessment in clinical chemistry in Korea. J Clin Pathol Qual Control 1991;13:1-13 (Korean).
  • 33. Min WK, Kim YK, Kwon OH, Kim KD, Kim SS, Kim JW, et al. Annual report on external quality assessment in clinical chemistry in Korea (2000). J Clin Pathol Qual Control 2001;23:1-14 (Korean).
  • 34. Hansen TW, Staessen JA, Zhang H, Torp-Pedersen D, Rasmussen S, Thijs L, et al. Cardiovascular outcome in relation to progression to hypertension in the Copenhagen MONICA Cohort. Am J Hypertens 2007;20:483-491. 17485007.ArticlePubMed
  • 35. Yun JE. The relation between weight changes and alanine aminotransferase levels in a nonalcoholic population [dissertation]. 2007. Seoul: Yonsei university.
Figure 1
Data cleaning process for the study population.
BMI, body mass index; SBP, systolic blood pressure; HTN, hypertension; DM, diabetes mellitus; DBP, diastolic blood pressure; FSG, fasting serum glucose; TC, total cholesterol.
epih-32-e2010003-g001.jpg
Table 1
Baseline characteristics of the study population according to baseline blood pressure
Characteristics Baseline blood pressure
p-value*
Normal (n= 12,401) High-normal (n=3,898)
Baseline (1994-1996)
Age’ (yr), mean±s.d 38.6±6.5 39.8±6.8 <0.0001
Gender
Men 77.9 83.4 <0.0001
Women 22.1 16.6
Body mass index (kg/m2) 22.9±2.4 23.4±2.5 <0.0001
Current smoking (yes), % 46.9 48.0 <0.0001
Alcohol drinking (yes), % 67.0 70.6 <0.0001
Regular exercise (yes), % 25.1 27.7 0.0012
Family history, %
 Hypertension, stroke, heart disease 14.8 15.0 0.7670
 Diabetes mellitus 7.6 6.7 0.0934
Systolic blood pressure (mmHg) 119.5±4.5 126.4 ±5.7 <0.0001
Diastolic blood pressure (mmHg) 78.0±3.6 83.4±3.6 <0.0001
Fasting serum glucose (mg/dL) 89.4 ±15.6 91.0 ±17.4 <0.0001
Total serum cholesterol (mg/dL) 187.3±31.1 189.5± 31.2 <0.0001

*p-value by t-test or χ2 test; Age and family history in 1992 presented because the data included individuals who participated in the health exam in 1992 from the KCPS data.

Table 2
Relationship between changes in cardiovascular disease risk factors and progression to hypertension in prehypertensive men at baseline
Changes in CVD risk factors Total no. No. of HTN (%) No. of censored p-value*
Health behavioral factors
Smoking habit change
 CS at baseline and follow-up 4,996 2,471 (49.5) 2,525 <0.0001
 CS at baseline, NS at follow-up 2,261 970 (42.9) 1,291
 NS at baseline, CS at follow-up 490 250 (51.0) 240
 NS at baseline and follow-up 4,540 2,138 (47.1) 2,402
Alcohol drinking habit change
 DR at baseline and follow-up 8,204 4,176 (50.9) 4,028 <0.0001
 DR at baseline, ND at follow-up 1,516 569 (37.5) 947
 ND at baseline, DR at follow-up 430 168 (39.1) 262
 ND at baseline and follow-up 1,993 886 (44.5) 1,107
Regular exercise habit change
 NRE at baseline and follow-up 7,206 3,575 (49.6) 3,631 <0.0001
 NRE at baseline, RE at follow-up 1,570 590 (37.6) 980
 RE at baseline, NRE at follow-up 2,190 1,079 (49.3) 1,111
 RE at baseline and follow-up 1,303 578 (44.4) 725
Comorbidity
Body mass index level change
 OBMI at baseline and follow-up 2,703 1,573 (58.2) 1,130 <0.0001
 OBMI at baseline, NBMI at follow-up 369 166 (45.0) 203
 NBMI at baseline, OBMI at follow-up 1,690 834 (49.3) 856
 NBMI at baseline and follow-up 8,139 3,576 (43.9) 4,563
Fasting serum glucose level change
 HFSG at baseline and follow-up 162 83 (51.2) 79 0.0071
 HFSG at baseline, NFSG at follow-up 103 57 (55.3) 46
 NFSG at baseline, HFSG at follow-up 541 282 (52.1) 259
 NFSG at baseline and follow-up 12,093 5,726 (47.3) 6,367
Serum total cholesterol level change
 HTC at baseline and follow-up 412 231 (56.1) 181 <0.0001
 HTC at baseline, NTC at follow-up 364 178 (48.9) 186
 NTC at baseline, HTC at follow-up 1,122 596 (53.1) 526
 NTC at baseline and follow-up 11,010 5,148 (46.8) 5,862

CVD, cardiovascular disease; HTN, hypertension; NS, never or former smoker; CS, current smoker; NDR, non-drinker; DR, current drinker; RE, those taking regular exercise; NRE, those not taking regular exercise; NBMI, those with a BMI <25.0 kg/m2; OBMI, those with a BMI ≥25.0 kg/m2; NFSG, those with a FSG <100 mg/dL; HFSG, those with a FSG ≥126 mg/dL; NTC, those with a TC <240 mg/dL; HTC, those with a TC ≥240 mg/dL.

*p-value by log-rank test.

Table 3
Relationship between changes in cardiovascular disease risk factors and progression to hypertension in prehypertensive women at baseline
Changes in CVD risk factors Total no. No. of HTN (%) No. of censored p-value*
Health behavioral factors
Alcohol drinking habit change
 DR at baseline and follow-up 269 104 (38.7) 165 0.2873
 DR at baseline, ND at follow-up 271 98 (36.2) 173
 ND at baseline, DR at follow-up 180 57 (31.7) 123
 ND at baseline and follow-up 2,220 784 (35.3) 1,436
Regular exercise habit change
 NRE at baseline and follow-up 2,293 827 (36.1) 1,466 <0.0001
 NRE at baseline, RE at follow-up 425 96 (22.6) 329
 RE at baseline, NRE at follow-up 308 122 (39.6) 186
 RE at baseline and follow-up 144 55 (38.2) 89
Comorbidity
Body mass index level change
 OBMI at baseline and follow-up 304 168 (55.3) 136 <0.0001
 OBMI at baseline, NBMI at follow-up 69 27 (39.1) 42
 NBMI at baseline, OBMI at follow-up 297 138 (46.5) 159
 NBMI at baseline and follow-up 2,720 863 (31.7) 1,857
Fasting serum glucose level change
 HFSG at baseline and follow-up 15 13 (86.7) 2 <0.0001
 HFSG at baseline, NFSG at follow-up 14 6 (42.9) 8
 NFSG at baseline, HFSG at follow-up 50 20 (40.0) 30
 NFSG at baseline and follow-up 3,312 1,157 (34.9) 2,155
Serum total cholesterol level change
 HTC at baseline and follow-up 91 44 (48.4) 47 0.0003
 HTC at baseline, NTC at follow-up 52 22 (42.3) 30
 NTC at baseline, HTC at follow-up 366 151 (41.3) 215
 NTC at baseline and follow-up 2,882 979 (34.0) 1,903

CVD, cardiovascular disease; HTN, hypertension; NDR, non-drinker; DR, current drinker; RE, those taking regular exercise; NRE, those not taking regular exercise; NBMI, those with a BMI <25.0 kg/m2; OBMI, those with a BMI ≥25.0 kg/m2; NFSG, those with a FSG <100 mg/dL; HFSG, those with a FSG ≥126 mg/dL; NTC, those with a TC <240 mg/dl; HTC, those with a TC ≥240 mg/dL.

*p-value by log-rank test.

Table 4
Risk factors for progression to hypertension in prehypertensive group at baseline
Men
Women
HR 95% CI HR 95% CI
Age 1.026 1.022-1.031 1.034 1.022-1.046
Family history of CVD
 No 1.000 1.000
 Yes 1.146 1.059-1.240 1.145 0.980-1.337
Health behavioral factors
Smoking habit change
 CS at baseline and follow-up 1.000
 CS at baseline, NS at follow-up 0.756 0.696-0.821 NA NA
 NS at baseline, CS at follow-up 0.996 0.864-1.149 NA NA
 NS at baseline and follow-up 0.917 0.859-0.978 NA NA
Drinking habit change
 DR at baseline and follow-up 1.000 1.000
 DR at baseline, ND at follow-up 0.669 0.607-0.738 0.829 0.613-1.121
 ND at baseline, DR at follow-up 0.676 0.571-0.800 0.745 0.525-1.055
 ND at baseline and follow-up 0.811 0.749-0.879 0.849 0.682-1.057
Regular exercise habit change
 NRE at baseline and follow-up 1.000 1.000
 NRE at baseline, RE at follow-up 0.653 0.593-0.718 0.534 0.426-0.669
 RE at baseline, NRE at follow-up 0.997 0.925-1.076 1.053 0.851-1.303
 RE at baseline and follow-up 0.808 0.735-0.889 0.997 0.740-1.343
Comorbidity
BMI level change
 OBMI at baseline and follow-up 1.000 1.000
 OBMI at baseline, NBMI at follow-up 0.715 0.593-0.861 0.634 0.401-1.001
 NBMI at baseline, OBMI at follow-up 0.752 0.684-0.827 0.764 0.585-0.997
 NBMI at baseline and follow-up 0.693 0.648-0.742 0.580 0.476-0.706
Fasting serumglucose level change
 HFSG at baseline and follow-up 1.000 1.000
 HFSG at baseline, NFSG at follow-up 1.073 0.732-1.573 0.542 0.179-1.639
 NFSG at baseline, HFSG at follow-up 0.811 0.611-1.076 0.254 0.110-0.587
 NFSG at baseline and follow-up 0.862 0.670-1.109 0.264 0.134-0.519
Serum total cholesterol level change
 HTC at baseline and follow-up 1.000 1.000
 HTC at baseline, NTC at follow-up 0.788 0.635-0.977 1.319 0.707-2.463
 NTC at baseline, HTC at follow-up 0.838 0.707-0.993 0.807 0.528-1.234
 NTC at baseline and follow-up 0.789 0.682-0.914 0.806 0.544-1.193

All covariates were included in the model. HR, hazard ratio; CI, confidence interval; CVD, cardiovascular disease; HTN, hypertension; NA, not available; NS, never or former smoker; CS, current smoker; NDR, non-drinker; DR, current drinker; RE, those taking regular exercise; NRE, those not taking regular exercise; NBMI, those with a BMI <25.0 kg/m2; OBMI, those with a BMI ≥25.0 kg/m2; NFSG, those with a FSG <100 mg/dL; HFSG, those with a FSG ≥126 mg/dL; NTC, those with a TC <240 mg/dL; HTC, those with a TC ≥240 mg/dL.

Figure & Data

References

    Citations

    Citations to this article as recorded by  
    • Association of hypertension with noodle consumption among Korean adults based on the Health Examinees (HEXA) study
      Suji Choi, Jungmin Park, Hyein Jung, Jiwon Jeong, Kyungjoon Lim, Sangah Shin
      Nutrition Research and Practice.2024; 18(2): 282.     CrossRef
    • Mixed effects logistic regression analysis of blood pressure among Ghanaians and associated risk factors
      Abdul-Karim Iddrisu, Ishmael Besing Karadaar, Joseph Gurah Junior, Bismark Ansu, Damoah-Asante Ernest
      Scientific Reports.2023;[Epub]     CrossRef
    • Assessing body mass index stages, individual diabetes and hypertension history effects on the risk of developing hypertension among Ghanaians: A cross‐sectional study
      Abdul‐Karim Iddrisu, Mohammed Adam
      Health Science Reports.2023;[Epub]     CrossRef
    • Prevalence and associated risk factors of hypertension and pre-hypertension among the adult population: findings from the Dubai Household Survey, 2019
      Heba Mamdouh, Wafa K. Alnakhi, Hamid Y. Hussain, Gamal M. Ibrahim, Amal Hussein, Ibrahim Mahmoud, Fatheya Alawadi, Mohamed Hassanein, Mona Abdullatif, Kadhim AlAbady, Sabya Farooq, Nabil Sulaiman
      BMC Cardiovascular Disorders.2022;[Epub]     CrossRef
    • HYPERTENSION SCREENING IN MULYOREJO PUBLIC HEALTH CENTER AT 2019: WHAT LESSONS LEARNED?
      Shifa Fauziyah, Budi Utomo, Teguh Hari Sucipto
      The Indonesian Journal of Public Health.2022; 17(1): 145.     CrossRef
    • Pre-Hypertension and Its Determinants in Healthy Young Adults: Analysis of Data from the Korean National Health and Nutrition Examination Survey VII
      Insil Jang
      International Journal of Environmental Research and Public Health.2021; 18(17): 9144.     CrossRef
    • Precision Medicine and Cardiovascular Health: Insights from Mendelian Randomization Analyses
      Wes Spiller, Keum Ji Jung, Ji-Young Lee, Sun Ha Jee
      Korean Circulation Journal.2020; 50(2): 91.     CrossRef
    • Pathophysiological mechanisms underlying the beneficial effects of physical activity in hypertension
      Jessica Gambardella, Marco Bruno Morelli, Xu‐Jun Wang, Gaetano Santulli
      The Journal of Clinical Hypertension.2020; 22(2): 291.     CrossRef
    • Incidence and risk factors for progression from prehypertension to hypertension: a 12-year Korean Cohort Study
      Eun Sun Yu, Kwan Hong, Byung Chul Chun
      Journal of Hypertension.2020; 38(9): 1755.     CrossRef
    • Excessive physical activity duration may be a risk factor for hypertension in young and middle-aged populations
      Zhongkai Zhu, Tianyu Feng, Yi Huang, Xinglan Liu, Han Lei, Ge Li, Dan Deng, Nan Zhang, Wei Huang
      Medicine.2019; 98(18): e15378.     CrossRef
    • 2018 Korean Society of Hypertension guidelines for the management of hypertension: part I-epidemiology of hypertension
      Hyeon Chang Kim, Sang-Hyun Ihm, Gheun-Ho Kim, Ju Han Kim, Kwang-il Kim, Hae-Young Lee, Jang Hoon Lee, Jong-Moo Park, Sungha Park, Wook Bum Pyun, Jinho Shin, Shung Chull Chae
      Clinical Hypertension.2019;[Epub]     CrossRef
    • Grape Seed Extract Supplementation Attenuates the Blood Pressure Response to Exercise in Prehypertensive Men
      Jong-Kyung Kim, Kyung-Ae Kim, Hyun-Min Choi, Seung-Kook Park, Charles L. Stebbins
      Journal of Medicinal Food.2018; 21(5): 445.     CrossRef
    • Cadmium body burden and increased blood pressure in middle-aged American Indians: the Strong Heart Study
      N Franceschini, R C Fry, P Balakrishnan, A Navas-Acien, C Oliver-Williams, A G Howard, S A Cole, K Haack, E M Lange, B V Howard, L G Best, K A Francesconi, W Goessler, J G Umans, M Tellez-Plaza
      Journal of Human Hypertension.2017; 31(3): 225.     CrossRef
    • Prevalence of prehypertension and associated risk factors among Chinese adults from a large-scale multi-ethnic population survey
      Tao Xu, Junting Liu, Guangjin Zhu, Junxiu Liu, Shaomei Han
      BMC Public Health.2016;[Epub]     CrossRef
    • Endothelium-dependent vasodilation effects of Panax notoginseng and its main components are mediated by nitric oxide and cyclooxygenase pathways
      Yanyan Wang, Yu Ren, Leilei Xing, Xiangdong Dai, Sheng Liu, Bin Yu, Yi Wang
      Experimental and Therapeutic Medicine.2016; 12(6): 3998.     CrossRef
    • 2013 Korean Society of Hypertension guidelines for the management of hypertension: part I–epidemiology and diagnosis of hypertension
      Jinho Shin, Jeong Bae Park, Kwang-il Kim, Ju Han Kim, Dong Heon Yang, Wook Bum Pyun, Young Gweon Kim, Gheun-Ho Kim, Shung Chull Chae
      Clinical Hypertension.2015;[Epub]     CrossRef
    • The Korean Society of Hypertension Guidelines for the Management of Hypertension in 2013: Its Essentials and Key Points
      Hae-Young Lee, Jeong Bae Park
      Pulse.2015; 3(1): 21.     CrossRef
    • Molecular Docking Simulations Provide Insights in the Substrate Binding Sites and Possible Substrates of the ABCC6 Transporter
      Mohammad Jakir Hosen, Abdullah Zubaer, Simrika Thapa, Bijendra Khadka, Anne De Paepe, Olivier M. Vanakker, Anthony George
      PLoS ONE.2014; 9(7): e102779.     CrossRef
    • Physical Activity and the Prevention of Hypertension
      Keith M. Diaz, Daichi Shimbo
      Current Hypertension Reports.2013; 15(6): 659.     CrossRef
    • Sympathovagal Imbalance in Young Prehypertensives: Importance of Male-Female Difference
      Gopal Krushna Pal, Pravati Pal, Venugopal Lalitha, Tarun Kumar Dutta, Chandrasekaran Adithan, Nivedita Nanda
      The American Journal of the Medical Sciences.2013; 345(1): 10.     CrossRef

    Figure
    • 0
    Cardiovascular Risk Factors for Incident Hypertension in the Prehypertensive Population
    Image
    Figure 1 Data cleaning process for the study population.BMI, body mass index; SBP, systolic blood pressure; HTN, hypertension; DM, diabetes mellitus; DBP, diastolic blood pressure; FSG, fasting serum glucose; TC, total cholesterol.
    Cardiovascular Risk Factors for Incident Hypertension in the Prehypertensive Population
    Characteristics Baseline blood pressure
    p-value*
    Normal (n= 12,401) High-normal (n=3,898)
    Baseline (1994-1996)
    Age’ (yr), mean±s.d 38.6±6.5 39.8±6.8 <0.0001
    Gender
    Men 77.9 83.4 <0.0001
    Women 22.1 16.6
    Body mass index (kg/m2) 22.9±2.4 23.4±2.5 <0.0001
    Current smoking (yes), % 46.9 48.0 <0.0001
    Alcohol drinking (yes), % 67.0 70.6 <0.0001
    Regular exercise (yes), % 25.1 27.7 0.0012
    Family history, %
     Hypertension, stroke, heart disease 14.8 15.0 0.7670
     Diabetes mellitus 7.6 6.7 0.0934
    Systolic blood pressure (mmHg) 119.5±4.5 126.4 ±5.7 <0.0001
    Diastolic blood pressure (mmHg) 78.0±3.6 83.4±3.6 <0.0001
    Fasting serum glucose (mg/dL) 89.4 ±15.6 91.0 ±17.4 <0.0001
    Total serum cholesterol (mg/dL) 187.3±31.1 189.5± 31.2 <0.0001
    Changes in CVD risk factors Total no. No. of HTN (%) No. of censored p-value*
    Health behavioral factors
    Smoking habit change
     CS at baseline and follow-up 4,996 2,471 (49.5) 2,525 <0.0001
     CS at baseline, NS at follow-up 2,261 970 (42.9) 1,291
     NS at baseline, CS at follow-up 490 250 (51.0) 240
     NS at baseline and follow-up 4,540 2,138 (47.1) 2,402
    Alcohol drinking habit change
     DR at baseline and follow-up 8,204 4,176 (50.9) 4,028 <0.0001
     DR at baseline, ND at follow-up 1,516 569 (37.5) 947
     ND at baseline, DR at follow-up 430 168 (39.1) 262
     ND at baseline and follow-up 1,993 886 (44.5) 1,107
    Regular exercise habit change
     NRE at baseline and follow-up 7,206 3,575 (49.6) 3,631 <0.0001
     NRE at baseline, RE at follow-up 1,570 590 (37.6) 980
     RE at baseline, NRE at follow-up 2,190 1,079 (49.3) 1,111
     RE at baseline and follow-up 1,303 578 (44.4) 725
    Comorbidity
    Body mass index level change
     OBMI at baseline and follow-up 2,703 1,573 (58.2) 1,130 <0.0001
     OBMI at baseline, NBMI at follow-up 369 166 (45.0) 203
     NBMI at baseline, OBMI at follow-up 1,690 834 (49.3) 856
     NBMI at baseline and follow-up 8,139 3,576 (43.9) 4,563
    Fasting serum glucose level change
     HFSG at baseline and follow-up 162 83 (51.2) 79 0.0071
     HFSG at baseline, NFSG at follow-up 103 57 (55.3) 46
     NFSG at baseline, HFSG at follow-up 541 282 (52.1) 259
     NFSG at baseline and follow-up 12,093 5,726 (47.3) 6,367
    Serum total cholesterol level change
     HTC at baseline and follow-up 412 231 (56.1) 181 <0.0001
     HTC at baseline, NTC at follow-up 364 178 (48.9) 186
     NTC at baseline, HTC at follow-up 1,122 596 (53.1) 526
     NTC at baseline and follow-up 11,010 5,148 (46.8) 5,862
    Changes in CVD risk factors Total no. No. of HTN (%) No. of censored p-value*
    Health behavioral factors
    Alcohol drinking habit change
     DR at baseline and follow-up 269 104 (38.7) 165 0.2873
     DR at baseline, ND at follow-up 271 98 (36.2) 173
     ND at baseline, DR at follow-up 180 57 (31.7) 123
     ND at baseline and follow-up 2,220 784 (35.3) 1,436
    Regular exercise habit change
     NRE at baseline and follow-up 2,293 827 (36.1) 1,466 <0.0001
     NRE at baseline, RE at follow-up 425 96 (22.6) 329
     RE at baseline, NRE at follow-up 308 122 (39.6) 186
     RE at baseline and follow-up 144 55 (38.2) 89
    Comorbidity
    Body mass index level change
     OBMI at baseline and follow-up 304 168 (55.3) 136 <0.0001
     OBMI at baseline, NBMI at follow-up 69 27 (39.1) 42
     NBMI at baseline, OBMI at follow-up 297 138 (46.5) 159
     NBMI at baseline and follow-up 2,720 863 (31.7) 1,857
    Fasting serum glucose level change
     HFSG at baseline and follow-up 15 13 (86.7) 2 <0.0001
     HFSG at baseline, NFSG at follow-up 14 6 (42.9) 8
     NFSG at baseline, HFSG at follow-up 50 20 (40.0) 30
     NFSG at baseline and follow-up 3,312 1,157 (34.9) 2,155
    Serum total cholesterol level change
     HTC at baseline and follow-up 91 44 (48.4) 47 0.0003
     HTC at baseline, NTC at follow-up 52 22 (42.3) 30
     NTC at baseline, HTC at follow-up 366 151 (41.3) 215
     NTC at baseline and follow-up 2,882 979 (34.0) 1,903
    Men
    Women
    HR 95% CI HR 95% CI
    Age 1.026 1.022-1.031 1.034 1.022-1.046
    Family history of CVD
     No 1.000 1.000
     Yes 1.146 1.059-1.240 1.145 0.980-1.337
    Health behavioral factors
    Smoking habit change
     CS at baseline and follow-up 1.000
     CS at baseline, NS at follow-up 0.756 0.696-0.821 NA NA
     NS at baseline, CS at follow-up 0.996 0.864-1.149 NA NA
     NS at baseline and follow-up 0.917 0.859-0.978 NA NA
    Drinking habit change
     DR at baseline and follow-up 1.000 1.000
     DR at baseline, ND at follow-up 0.669 0.607-0.738 0.829 0.613-1.121
     ND at baseline, DR at follow-up 0.676 0.571-0.800 0.745 0.525-1.055
     ND at baseline and follow-up 0.811 0.749-0.879 0.849 0.682-1.057
    Regular exercise habit change
     NRE at baseline and follow-up 1.000 1.000
     NRE at baseline, RE at follow-up 0.653 0.593-0.718 0.534 0.426-0.669
     RE at baseline, NRE at follow-up 0.997 0.925-1.076 1.053 0.851-1.303
     RE at baseline and follow-up 0.808 0.735-0.889 0.997 0.740-1.343
    Comorbidity
    BMI level change
     OBMI at baseline and follow-up 1.000 1.000
     OBMI at baseline, NBMI at follow-up 0.715 0.593-0.861 0.634 0.401-1.001
     NBMI at baseline, OBMI at follow-up 0.752 0.684-0.827 0.764 0.585-0.997
     NBMI at baseline and follow-up 0.693 0.648-0.742 0.580 0.476-0.706
    Fasting serumglucose level change
     HFSG at baseline and follow-up 1.000 1.000
     HFSG at baseline, NFSG at follow-up 1.073 0.732-1.573 0.542 0.179-1.639
     NFSG at baseline, HFSG at follow-up 0.811 0.611-1.076 0.254 0.110-0.587
     NFSG at baseline and follow-up 0.862 0.670-1.109 0.264 0.134-0.519
    Serum total cholesterol level change
     HTC at baseline and follow-up 1.000 1.000
     HTC at baseline, NTC at follow-up 0.788 0.635-0.977 1.319 0.707-2.463
     NTC at baseline, HTC at follow-up 0.838 0.707-0.993 0.807 0.528-1.234
     NTC at baseline and follow-up 0.789 0.682-0.914 0.806 0.544-1.193
    Table 1 Baseline characteristics of the study population according to baseline blood pressure

    *p-value by t-test or χ2 test; Age and family history in 1992 presented because the data included individuals who participated in the health exam in 1992 from the KCPS data.

    Table 2 Relationship between changes in cardiovascular disease risk factors and progression to hypertension in prehypertensive men at baseline

    CVD, cardiovascular disease; HTN, hypertension; NS, never or former smoker; CS, current smoker; NDR, non-drinker; DR, current drinker; RE, those taking regular exercise; NRE, those not taking regular exercise; NBMI, those with a BMI <25.0 kg/m2; OBMI, those with a BMI ≥25.0 kg/m2; NFSG, those with a FSG <100 mg/dL; HFSG, those with a FSG ≥126 mg/dL; NTC, those with a TC <240 mg/dL; HTC, those with a TC ≥240 mg/dL.

    *p-value by log-rank test.

    Table 3 Relationship between changes in cardiovascular disease risk factors and progression to hypertension in prehypertensive women at baseline

    CVD, cardiovascular disease; HTN, hypertension; NDR, non-drinker; DR, current drinker; RE, those taking regular exercise; NRE, those not taking regular exercise; NBMI, those with a BMI <25.0 kg/m2; OBMI, those with a BMI ≥25.0 kg/m2; NFSG, those with a FSG <100 mg/dL; HFSG, those with a FSG ≥126 mg/dL; NTC, those with a TC <240 mg/dl; HTC, those with a TC ≥240 mg/dL.

    *p-value by log-rank test.

    Table 4 Risk factors for progression to hypertension in prehypertensive group at baseline

    All covariates were included in the model. HR, hazard ratio; CI, confidence interval; CVD, cardiovascular disease; HTN, hypertension; NA, not available; NS, never or former smoker; CS, current smoker; NDR, non-drinker; DR, current drinker; RE, those taking regular exercise; NRE, those not taking regular exercise; NBMI, those with a BMI <25.0 kg/m2; OBMI, those with a BMI ≥25.0 kg/m2; NFSG, those with a FSG <100 mg/dL; HFSG, those with a FSG ≥126 mg/dL; NTC, those with a TC <240 mg/dL; HTC, those with a TC ≥240 mg/dL.


    Epidemiol Health : Epidemiology and Health
    TOP