
Articles
- Page Path
- HOME > Epidemiol Health > Volume 31; 2009 > Article
-
Original Article
Validity of Stature-predicted Equations using Knee Height for Elderly and Mobility Impaired Persons in Koreans - In Cheol Hwang1, Kyoung Kon Kim1, Hee Cheol Kang2, Dae Ryong Kang3
-
Epidemiol Health 2009;31:e2009004.
DOI: https://doi.org/10.4178/epih/e2009004
Published online: October 12, 2009
1Department of Family Medicine, Gachon University Gil Medical Center, Incheon, Korea.
2Department of Family Medicine, Yonsei University College of Medicine, Seoul, Korea.
3Graduate School of Public Health, Yonsei University, Seoul, Korea.
- Correspondence to: Dae Ryong Kang. Graduate School of Public Health, Yonsei University, 250 Seongsan-no, Seodaemun-gu, Seoul 120-752, Korea. Tel: +82-2-2228-0456 Fax: +82-2-2227-7744, drkang@yuhs.ac
• Received: July 12, 2009 • Accepted: August 10, 2009
© 2009, Korean Society of Epidemiology
This is an open-access article distributed under the terms of the Creative Commons Attribution License, which permits unrestricted use, distribution, and reproduction in any medium, provided the original work is properly cited.
- 18,150 Views
- 163 Download
- 9 Crossref
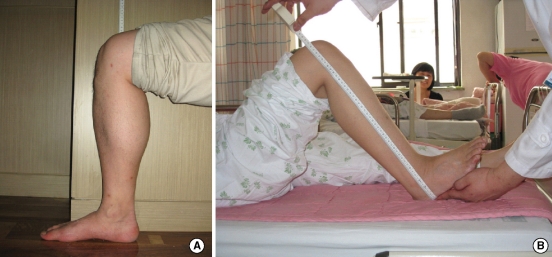
Figure & Data
References
Citations
Citations to this article as recorded by 
- Anthropometric Equations to Determine Maximum Height in Adults ≥ 60 Years: A Systematic Review
Arnulfo Ramos-Jiménez, Rosa P. Hernández-Torres, Isaac A. Chávez-Guevara, José A. Alvarez-Sanchez, Marco A. García-Villalvazo, Miguel Murguía-Romero
International Journal of Environmental Research and Public Health.2022; 19(9): 5072. CrossRef - Height Prediction Using the Knee Height Measurement Among Indonesian Children
Fernando Rumapea, Eddy Fadlyana, Meita Dhamayanti, Rodman Tarigan, Rahmayani Rahmayani, Kusnandi Rusmil
Food and Nutrition Bulletin.2021; 42(2): 247. CrossRef - A Knee Height Equation for Estimating Height of Vietnamese Adults
Tu Huu Nguyen, Yen Ngoc Ma, Linh Thuy Nguyen
Nutrition Today.2021; 56(6): 306. CrossRef - Bayes factor: A useful tool to quantitatively evaluate and compare performance of multiple stature estimation equations
Yangseung Jeong, Ashlin P. Harris, Omar Ali, Yochun Jung
Forensic Science International.2020; 312: 110299. CrossRef - Estimating the height of elderly nursing home residents: Which equation to use?
Marcos Felipe Silva de Lima, Larissa Praça de Oliveira, Natália Louise de Araújo Cabral, Laura Camila Pereira Liberalino, Ursula Viana Bagni, Kenio Costa de Lima, Clélia de Oliveira Lyra, Gary Liguori
PLOS ONE.2018; 13(10): e0205642. CrossRef - Accuracy of height estimation and tidal volume setting using anthropometric formulas in an ICU Caucasian population
Erwan L’her, Jérôme Martin-Babau, François Lellouche
Annals of Intensive Care.2016;[Epub] CrossRef - Enteral nutritional intake in adult korean intensivecare patients
Hyunjung Kim, Nancy A. Stotts, Erika S. Froelicher, Marguerite M. Engler, Carol Porter
American Journal of Critical Care.2013; 22(2): 126. CrossRef - Adequacy of early enteral nutrition in adult patients in the intensive care unit
Hyunjung Kim, Nancy A Stotts, Erika S Froelicher, Marguerite M Engler, Carol Porter, Heejeong Kwak
Journal of Clinical Nursing.2012; 21(19pt20): 2860. CrossRef - The estimation of body height from ulna length in healthy adults from different ethnic groups
A. M. Madden, T. Tsikoura, D. J. Stott
Journal of Human Nutrition and Dietetics.2012; 25(2): 121. CrossRef
 PubReader
 ePub Link
 Cite
Cite

