
Articles
- Page Path
- HOME > Epidemiol Health > Volume 43; 2021 > Article
-
Original Article
Effects of exposure to ambient air pollution on pulmonary function impairment in Korea: the 2007-2017 Korea National Health and Nutritional Examination Survey -
Soo Beom Choi1
 , Sungha Yun1, Sun-Ja Kim1, Yong Bum Park2,3, Kyungwon Oh1
 -
Epidemiol Health 2021;43:e2021082.
DOI: https://doi.org/10.4178/epih.e2021082
Published online: October 18, 2021
1Division of Health and Nutrition Survey and Analysis, Korea Disease Control and Prevention Agency, Cheongju, Korea
2Lung Research Institute of Hallym University College of Medicine, Chuncheon, Korea
3Division of Pulmonary, Allergy and Critical Care Medicine, Department of Internal Medicine, Hallym University Kangdong Sacred Heart Hospital, Seoul, Korea
- Correspondence: Kyungwon Oh, Division of Health and Nutrition Survey and Analysis, Korea Disease Control and Prevention Agency, 187 Osongsaengmyeong 2-ro, Heungduk-gu, Cheongju 28159, Korea, E-mail: kwoh27@korea.kr
© 2021, Korean Society of Epidemiology
This is an Open Access article distributed under the terms of the Creative Commons Attribution Non-Commercial License (https://creativecommons.org/licenses/by-nc/4.0) which permits unrestricted non-commercial use, distribution, and reproduction in any medium, provided the original work is properly cited.
Abstract
-
OBJECTIVES
- This study aimed to investigate the association between pulmonary function and air pollution using 2007–2017 data from the Korea National Health and Nutrition Examination Survey, a nationwide cross-sectional representative survey.
-
METHODS
- A total of 27,378 participants that had sampling weights from a complex sample survey were included in this study. Using the data for forced expiratory volume in 1 second and forced vital capacity, the participants with pulmonary function impairment were classified according to the criteria of restrictive lung disease and chronic obstructive pulmonary disease (COPD). Exposure to ambient air pollution was estimated using the Community Multiscale Air Quality model. Multivariate linear and logistic regression analyses with complex samples were used to determine the associations between pulmonary function and air pollution after adjusting for covariates.
-
RESULTS
- In total, 13.2% of the participants aged >40 years had COPD, and 10.7% were classified as being in the restrictive lung disease group. According to the multivariate logistic regression model, the odds ratios for the fourth quartiles of particulate matter less than 10 μm in diameter (PM10), particulate matter less than 2.5 μm in diameter (PM2.5) and carbon monoxide (CO) with a 2-year lag period were 1.203 (95% confidence interval [CI], 1.036 to 1.396), 1.283 (95% CI, 1.101 to1.495), and 1.292 (95% CI, 1.110 to 1.504), respectively, using the restrictive lung disease group as an event after adjusting for covariates in the complex sample.
-
CONCLUSIONS
- Long-term exposure to PM10, PM2.5, and CO was significantly associated with pulmonary function, especially restrictive lung disease.
- Chronic obstructive pulmonary disease (COPD) is a critical disease with a high burden to society and is one of the most important causes of mortality worldwide [1]. Among the exogenous risk factors for developing COPD, such as air pollution and work exposure, cigarette smoking is a well-known factor [1]. The Korea Disease Control and Prevention Agency (KDCA) reported that the lowest smoking rate in the past 20 years was achieved in 2019, with a reduction from 66.3% in 1998 to 36.7%, and that the number of smokers in Korea is gradually decreasing [2]. Outdoor air pollution, another risk factor for COPD, has been extensively studied, and previous studies have revealed associations between respiratory diseases and air pollution [3,4]. Outdoor pollutants, including sulfur dioxide (SO2), nitrogen oxides (NO2), carbon monoxide (CO), and ozone (O3), along with particulate matter (PM), are produced from vehicular traffic and combustion processes [5].
- In a population-based cohort study with a 5-year exposure period in Canada, long-term exposure to ambient air pollution, including traffic-related fine particulate pollution, was associated with an increased risk of COPD [6]. An interquartile range elevation in black carbon concentrations, including those of PM less than 2.5 μm in diameter (PM2.5), NO2, and nitric oxide, was associated with a 6% increase in COPD hospitalizations and a 7% increase in death from COPD during a 4-year follow-up period [6]. In a study including 2,754 White participants with restrictive lung disease in the population-based Tucson Epidemiological Study of Airway Obstructive Disease study, the participants with a restrictive spirometric pattern had significantly higher risks for all-cause, heart disease-specific, stroke-specific, and diabetes-specific mortality, with adjusted hazard ratios (HRs) of 1.7 (95% confidence interval [CI], 1.3 to 2.3), 2.0 (95% CI, 1.3 to 3.1), 2.4 (95% CI, 0.9 to 6.3), and 8.0 (95% CI, 2.9 to 21.8), respectively [7]. Therefore, it is necessary to include both restrictive lung disease and COPD groups when investigating the associations among pulmonary function, air pollution, and mortality. However, few systematic studies have examined the association between COPD and air pollution in Korea; hence, studies with representative samples are needed.
- This study aimed to investigate the associations between pulmonary function and air pollution using a nationwide cross-sectional representative survey. Pulmonary function was examined through an analysis of restrictive and obstructive lung disease groups. Meanwhile, air pollution exposure was evaluated based on individual exposures to PM less than 10 μm in diameter (PM10), PM2.5, SO2, NO2, CO, and O3, which were categorized as short-term, medium-term, and long-term [8]. Moreover, mortality was followed up until December 2019 to confirm the association between pulmonary function and mortality based on death certificate data from Statistics Korea [8].
INTRODUCTION
- Study population
- The Korea National Health and Nutrition Examination Survey (KNHANES) is a large-scale annual nationwide survey conducted by the KDCA [9]. A complex sample design was used in the KNHANES to ensure representative sampling of the Korean population [10]. In this study, we included 89,630 participants of the KNHANES IV–VI (2007–2017). This cross-sectional survey was conducted annually among different participants over a period of 11 years. Among the 89,630 participants, 82,565 agreed to link their data and death certificates and were included in the mortality analysis. Participants’ mortality status was monitored until December 31, 2019. We included 30,252 participants aged >40 years with sampling weights for lung function because the KDCA has been conducting lung-function surveys on participants aged >40 years since 2010. After excluding participants who had missing data, a total of 27,378 participants were included in the analysis.
- Variables
- Spirometry was performed by 4 technicians using a dry rolling seal spirometer (Model 2130; SensorMedics, Yorba Linda, CA, USA), and spirometric prediction equations were derived from survey data on non-smokers with normal chest X-ray findings and no history of respiratory disease or symptoms [11]. Using data on forced expiratory volume in 1 second (FEV1) and forced vital capacity (FVC), participants were classified into restrictive lung disease or COPD groups according to the severity of COPD based on the definition of the Global Initiative for COPD; normal (FEV1/FVC ≥0.7 and percent-predicted FVC [FVCp] ≥80%), restrictive (FEV1/FVC ≥0.7 and FVCp <80%), mild obstruction (FEV1/FVC <0.7 and percent predicted FEV1 [FEV1p] ≥80%), moderate obstruction (FEV1/FVC <0.7 and 50 ≤FEV1p <80%), and severe and very severe obstruction (FEV1/FVC <0.7 and FEV1p <50%) [7,12].
- There are no specific air pollution data at the city or district level because of the limited number of air-quality monitoring stations. Thus, to estimate air pollution data of the administrative districts in Korea, we used a prediction model based on data from the Korean Air Quality Forecasting System (KAQFS) [13]. The KAQFS included the Sparse Matrix Operator Kernel Emissions version 2.7 and Community Multiscale Air Quality version 4.7.1, which used emission inventories, including the Multi-Resolution Emission Inventory for China, Regional Emission Inventory in Asia, and Clean Air Policy Support System [14]. Detailed descriptions of the model have been published previously [14,15].
- Data assimilation was applied to the chemical transport model to calculate the concentration of air pollutants [15]. The air quality in the Korean peninsula was assessed according to grid sizes of 9 km×9 km, with a fine grid size of 3 km×3 km in the metropolitan area of Seoul. We used these values to calculate weighted mean values for the 3,470 administrative districts of the residential addresses in the KNHANES. We estimated the daily concentrations of PM10 (μg/m3), PM2.5 (μg/m3), SO2 (parts per billion [ppb]), NO2 (ppb), CO (ppb), and O3 (ppb) using the KAQFS data from 2005 to 2017 [15]. The estimations for air pollution were validated using real measurement data of air quality in the metropolitan area from 2005 to 2017 (PM2.5, 2015–2017) in AIRKOREA [16]. The validity of the estimations for PM10, PM2.5, SO2, NO2, CO, and O3 of the KAQFS was shown by correlation coefficients of 0.89, 0.82, 0.82, 0.90, 0.89, and 0.82, respectively [17]. The KAQFS data were combined by matching the residential address of the participants and the survey date [17].
- The duration of exposure to air pollution was classified as short-term, medium-term, or long-term. The exposure values during lag periods were calculated as the mean values of the time-series data for air pollution at the residential address from the survey date to before the lag period. Short-term periods included 1, 2, … 14 days; medium-term periods included 1, 2, … 6 months; and long-term periods included 1, 2, … 5 years [17].
- Age, sex, residential area, education level, household income, and smoking status were significantly associated with the prevalence of COPD in Korea [11]. In another previous study, a higher prevalence of COPD in Koreans was associated with older age, male sex, lower educational level, more frequent smoking, and lower body mass index (BMI) [18]. To consider the influence of meteorological factors, we collected data on temperature and relative humidity of the residential area at the date of survey. Therefore, we included age, sex, residential area, education level, household income, smoking status, obesity, temperature, and relative humidity as covariates.
- Data on age, sex, residential area (urban or rural), education level (≤elementary school, middle school, high school, or ≥college), and household income were obtained through interviews [8]. If a participant resided in an eup or a myeon (town or township), then his/her place of residence was defined as rural, whereas if he/she resided in a dong (neighborhood), then his/her place of residence was defined as urban [11]. Household income was equivalence-adjusted with quartiles (lower, lower middle, upper middle, and upper) [19]. Smoking status (≥5 packs in a lifetime and current smoking) was self-reported. BMI was calculated using height and weight. A BMI <18.5 kg/m2 was classified as underweight, whereas a BMI ≥25.0 kg/m2 was classified as obesity.
- Statistical analysis
- The weighted characteristics of the participants stratified by pulmonary function are reported as means (standard error of mean) for continuous variables and as percentages (standard error of percentage) for categorical variables. Multivariate logistic regression analysis with complex samples was performed to confirm the associations between pulmonary function and air pollution. Air-pollution variables were categorized into quartiles for the logistic regression analysis. The model for restrictive lung disease included a binary dependent variable, which consisted of the normal population as a reference and the restrictive lung disease group as the event. To identify the lag period with high beta coefficients, we fitted 6 air-pollution variables and 26 lag periods into all combinations of the multivariate logistic regression model for restrictive lung disease. The dependent variable for the COPD model consisted of the normal population as a reference and the COPD group as the event. The dependent variable for the model of ≥moderate obstruction consisted of the normal population as a reference and the moderate, severe, and very severe obstruction groups as events. Moreover, we performed stratified analyses for sex and smoking status. Multivariate linear regression analysis with complex samples was performed with FVCp, FEV1p, and FEV1/FVC as dependent variables. The multivariate linear regression analysis included the same covariates as the multivariate logistic regression analysis. The low-rank regression splines were specified in the framework of generalized additive models and fitted to the penalized likelihood estimation (GAMPL in SAS) to observe changes in pulmonary function with increasing concentrations of air pollutants [20].
- To determine whether pulmonary function is a risk factor for mortality, we constructed Cox proportional hazard models with HRs and 95% CIs, adjusted for the same covariates as multivariate logistic regression. We used the dates of death and cause of death as defined by the International Classification of Disease 10th edition (ICD-10) code given in death certificates. All-cause death was defined as death from any cause other than external causes of morbidity (S00–Y98) [8]. Participants who did not have death certificate records were considered censored in December 2019 [8]. Survival time was defined as the time interval (month) between the survey date and the date of death according to the death certificate. Cox models were constructed with all-cause death as the dependent variable. The proportionality of hazard assumption for the Cox regression model was verified using scaled Schoenfeld residuals [8]. Statistical analyses were performed using SAS version 9.4 (SAS Institute Inc., Cary, NC, USA). A p-value <0.05 was considered to indicate statistical significance.
- Ethics statement
- All KNHANES participants provided written informed consent to participate in the survey and for their personal data to be used [9]. The Institutional Review Board of the KDCA approved this study (approval No. 2019-05-04-C-A).
MATERIALS AND METHODS
Pulmonary function
Air pollution exposure
Definition of covariates
- Participant characteristics
- Table 1 shows the weighted characteristics of participants stratified by pulmonary function. In total, 13.2% of participants aged >40 years had COPD, and 10.7% were included in the restrictive lung disease group. The proportion of male participants was higher than that of female participants in both the restrictive lung disease and COPD groups. The proportion of current smokers in the COPD group was higher than that in the restrictive lung disease group.
- Association between pulmonary function and air pollution
- To identify the optimal lag period, beta coefficients were calculated using logistic regression models for each air pollution variable, as shown in Supplementary Material 1. The beta coefficients for long-term exposure were higher than those for short-term and medium-term exposure, and the beta coefficients of PM10, PM2.5, CO with a 2-year lag period had significant and positive values. Therefore, we selected air pollution exposure with a 2-year lag period after a detailed statistical analysis. Exposure to each pollutant with a 2-year lag was defined as the mean value of the time-series data for each air pollutant at the residential address from 2 years before the survey date.
- Table 2 shows the results of quartiles for air-pollution variables with a 2-year lag period using multivariate logistic regression analysis with complex samples after adjusting for covariates. The odds ratios (ORs) of the fourth quartiles of PM10, PM2.5, NO2, and CO with a 2-year lag period in the model for restrictive lung disease, with the restrictive lung disease group as an event, were 1.203 (95% CI, 1.036 to 1.396), 1.283 (95% CI, 1.101 to 1.495), and 1.292 (95% CI, 1.110 to 1.504), respectively, according to the total analysis. The fourth quartiles of PM10 in the model for ≥moderate obstruction for the total population were significantly associated with having moderate, severe, and very severe obstruction. The model for COPD, which had the COPD group as the event group (with the exclusion of the restrictive lung disease group), did not show any significant associations between air pollution and the COPD group.
- In the stratified analysis of male participants, the fourth quartiles of PM2.5 and CO in the model for restrictive lung disease were significantly associated with the restrictive lung disease group. In the stratified analysis of female participants, the fourth quartiles of PM2.5 and CO in the model for restrictive lung disease were significantly associated with the restrictive lung disease group. In the stratified analysis of current smokers, the OR of the fourth quartile of PM10 in the model for restrictive lung disease was 1.493 (95% CI, 1.082 to 2.060), which was the highest value. In non-smokers, the fourth quartiles of PM10 and CO in the model for ≥moderate obstruction were significantly associated with COPD, with the exclusion of the mild obstruction group. Moreover, in the stratified analysis of non-smokers, the ORs of the fourth quartiles of NO2 with a 2-year lag period in the model for COPD and the model for ≥moderate obstruction were 1.331 (95% CI, 1.113 to 1.593) and 1.384 (95% CI, 1.105 to 1.733), respectively. Long-term exposure to SO2 did not show any significant associations with pulmonary function, and long-term exposure to O3 showed negative associations with pulmonary function, as shown in Supplementary Material 2.
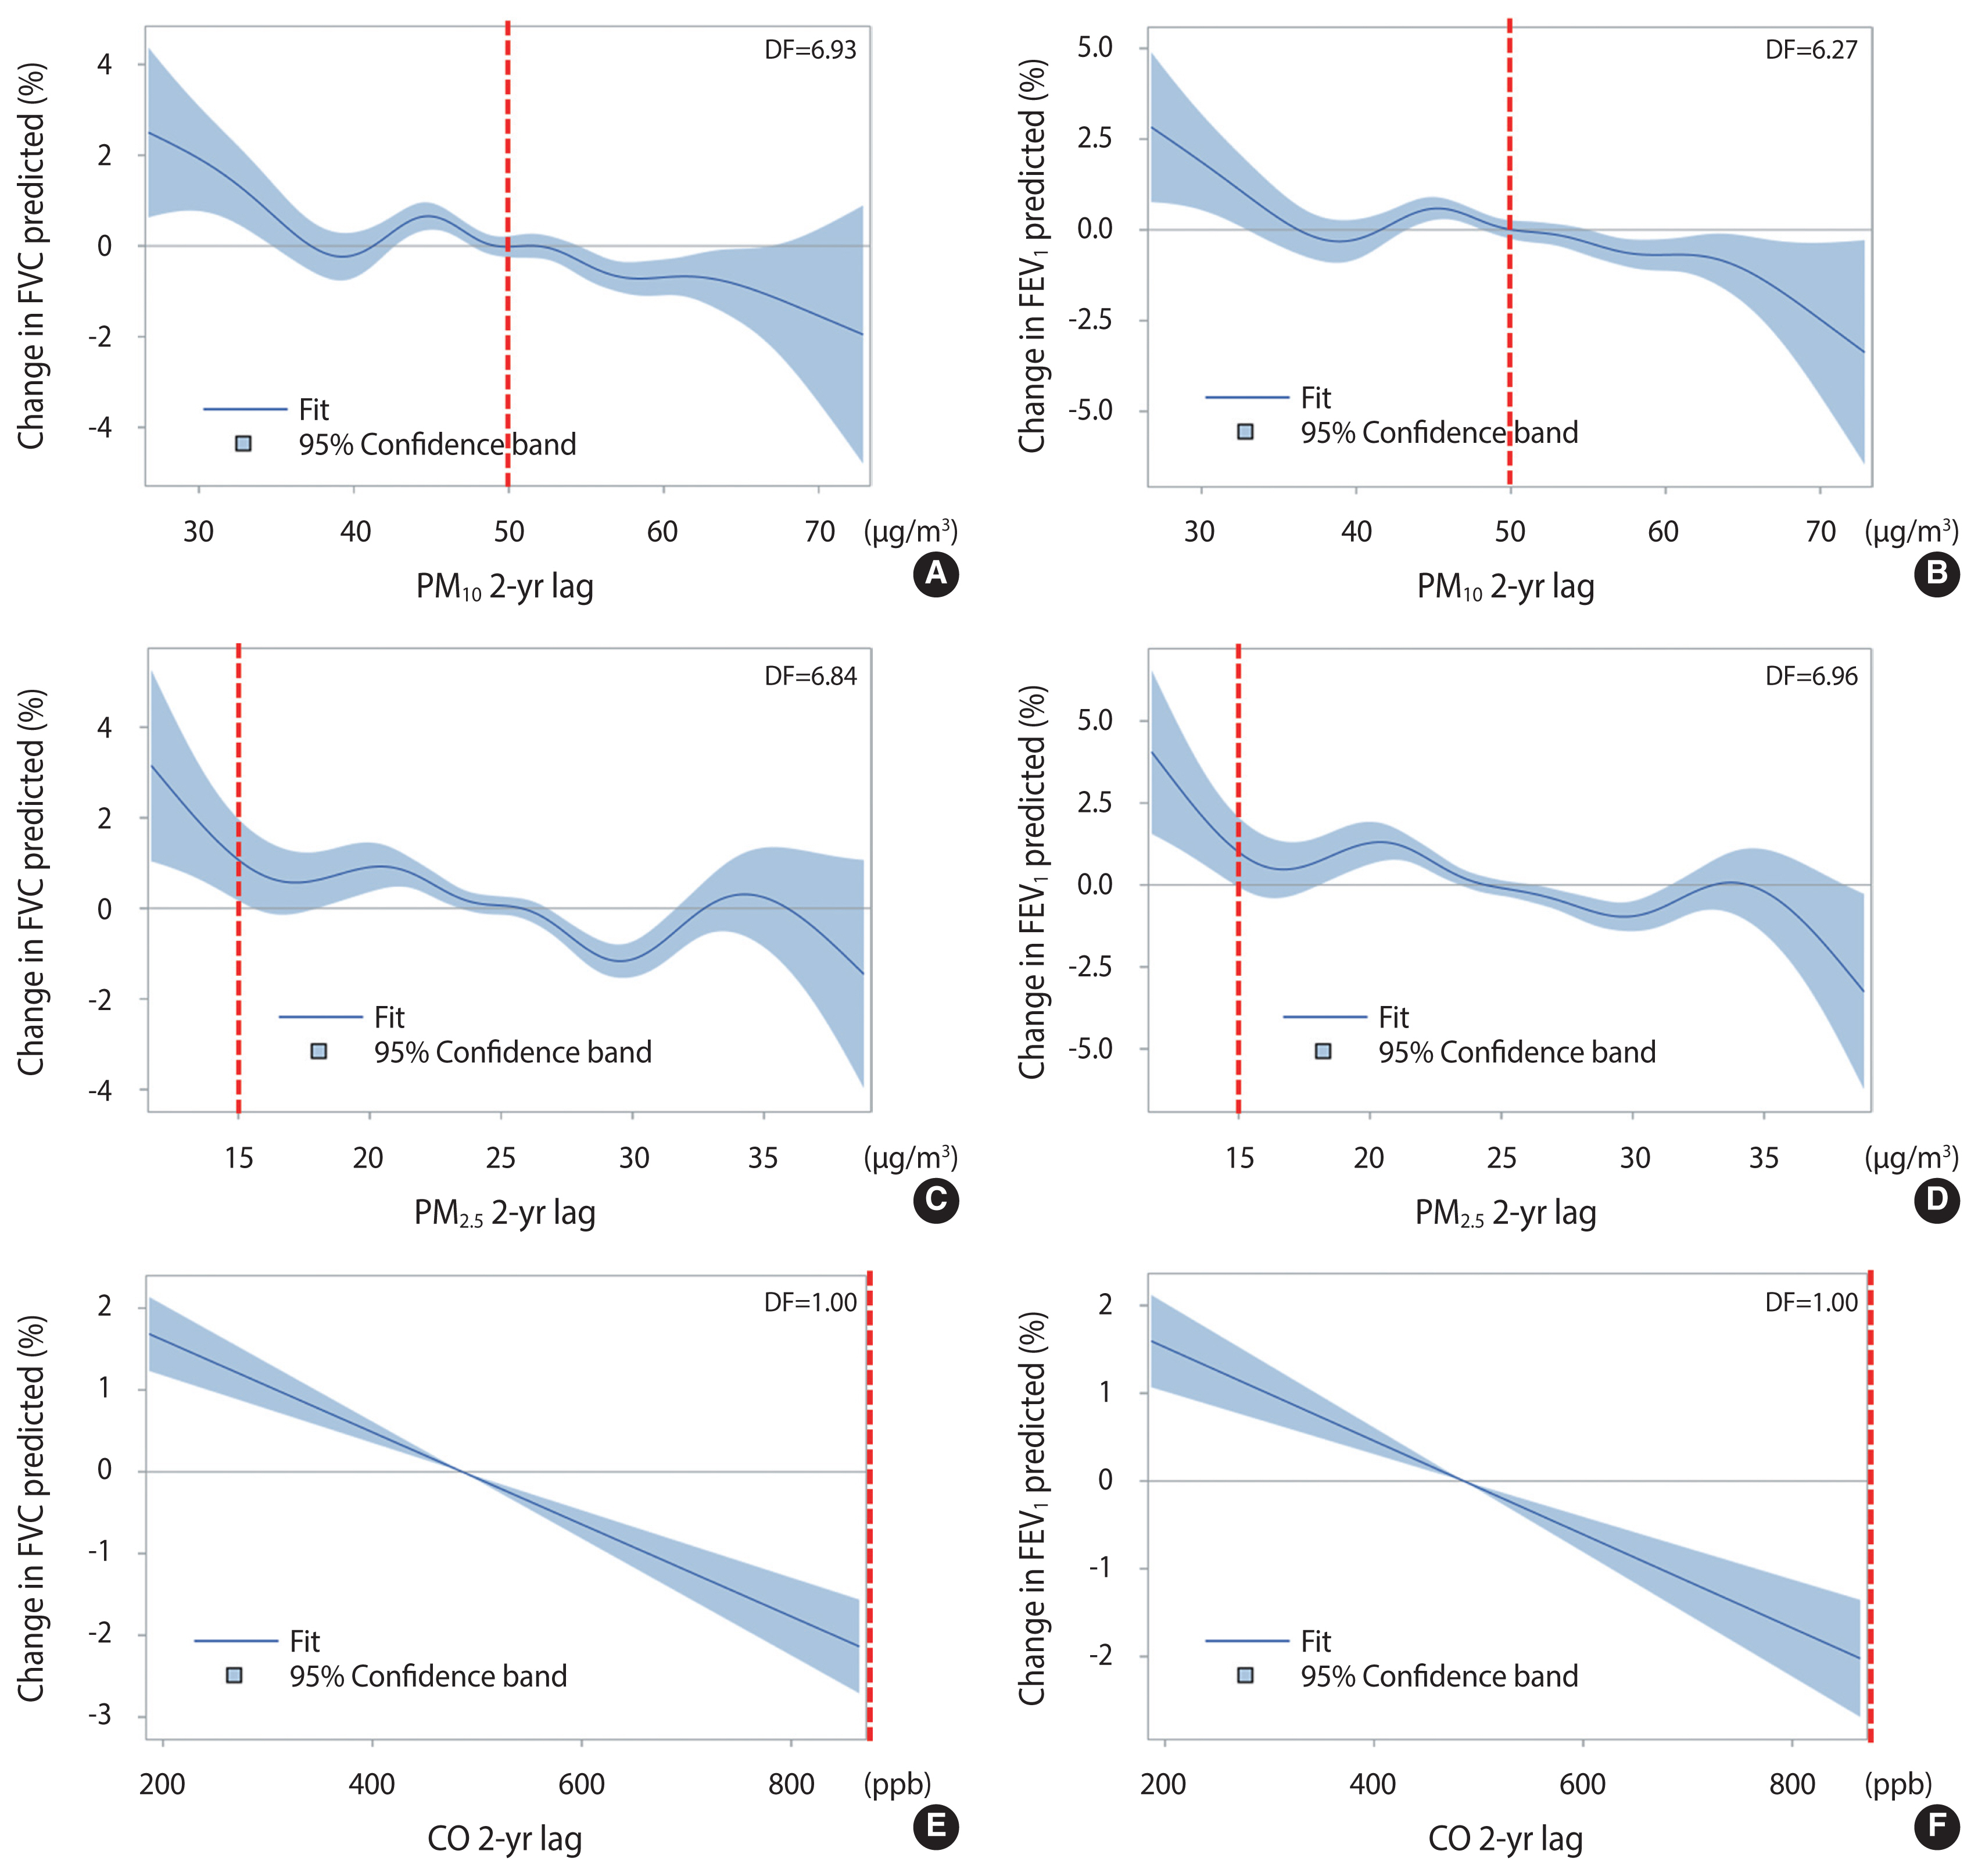
- Table 3 shows the results of multivariate linear regression analysis for pulmonary function variables, which included FVCp, FEV1p, and FEV1/FVC. In the linear regression analysis, after adjusting for the same covariates as the multivariate logistic regression analysis, exposure to PM10, PM2.5, and CO with a 2-year lag was negatively associated with FVCp and FEV1p. Only the third quartile of PM2.5 was significantly associated with FEV1/FVC. Figure 1 shows the changes in pulmonary function with increasing concentrations of air pollutants with spline terms using a generalized additive model, with the red dotted lines indicating the standard atmospheric concentrations according to the Ministry of Environment in Korea [21]. The spline curves of PM10, PM2.5, and CO showed negative associations with changes in FVCp and FEV1p. The changes in FVCp and FEV1p both became negative at approximately 490 ppb CO.
- Association of pulmonary function and mortality
- Table 4 shows the HRs of participants stratified by pulmonary function. Among 27,378 participants of the KNHANES 2007–2017, 1,015 all-cause deaths occurred, with the exclusion of external causes of morbidity. After adjusting for the same covariates as in the multivariate logistic regression analysis, participants in the restrictive lung disease group had a higher HR of all-cause mortality (HR, 1.585; 95% CI, 1.332 to 1.886) compared with those in the normal pulmonary function group. This HR of the restrictive lung disease group was higher than those of the mild obstruction group (HR, 1.278; 95% CI, 1.052 to 1.551) and the moderate obstruction group (HR, 1.415; 95% CI, 1.170 to 1.710).
RESULTS
- This is the first study to confirm the association between air pollution and restrictive lung disease using a nationwide cross-sectional representative survey in Korea. Multivariate logistic regression models demonstrated associations between restrictive lung disease and long-term exposure to air pollution. Notably, participants with high PM10 exposure with a 2-year lag period had a higher risk of having restrictive lung disease (FEV1/FVC ≥0.7 and FVCp <80%).
- Previous studies have investigated the association between pulmonary function and exposure to ambient air pollution [3,4,6,19]. A study including 161 non-COPD participants and 296 COPD participants who resided in areas near cement plants in Korea reported a significant association between annual average PM10 concentrations and FVC, but not FEV1 [22]. Furthermore, high PM10 concentrations were associated with worsened wheezing, particularly in COPD patients, based on a hospital-based panel study of Korean adults with 75 COPD participants and 90 healthy controls [23]. The mechanisms underlying the association between PM and COPD include decreased lung function due to increased black carbon content in airway macrophages, increased neutrophils and lymphocytes in the sputum due to exposure to diesel exhaust, and activation of the inflammatory response in the lungs due to concentrated ambient particles [6]. CO is formed by incomplete fuel combustion and reduces the flow of oxygen in the bloodstream [24]. Exposure to diesel exhaust also causes inflammation in the lungs, which may aggravate chronic respiratory symptoms and increase the frequency or intensity of asthma attacks [24].
- In our results, restrictive lung disease was significantly associated with greater exposure to PM10, PM2.5, and CO. A previous study examined the association between air pollution exposure and restrictive pulmonary function and reported that the effect estimates of long-term exposure to ambient air pollution for FVC were stronger than those for FEV1. In addition, long-term exposure to low levels of ambient air pollution was associated with restrictive ventilatory patterns [25]. Long-term improvements in air quality were associated with significant positive effects on lung-function and growth in children [26,27]. Therefore, exposure to air pollution could be associated with reduced lung growth rather than accelerated lung function decline [25]. However, only a few studies have explored the mechanism between exposure to air pollution and restrictive pulmonary function; therefore, systematic studies of the relevant pathways are warranted.
- Garcia-Aymerich et al. [28] investigated the association between pulmonary function impairment and mortality using a population-based sample of 20,571 Americans with a 10-year follow-up period. They reported adjusted HRs for all-cause mortality of 1.8 (95% CI, 1.5 to 2.1), 1.4 (95% CI, 1.2 to 1.6), 1.5 (95% CI, 1.3 to 1.8), and 2.7 (95% CI, 2.2 to 3.4) in the restrictive, mild obstruction, moderate obstruction, and severe and very severe obstruction groups, respectively. The HR of the restrictive lung disease group was higher than those of the mild obstruction and moderate obstruction groups [28], which is consistent with our results. Among the 211 subjects with spirometric restriction at enrollment and with available follow-up data, 38% of the participants in the restrictive lung disease group developed airway obstruction, and none of the participants with restrictive lung disease developed cigarette-related COPD based on the lower smoking rates in the normal and restrictive lung disease groups than in the COPD group [7]. Another study analyzed the members of the Cardiovascular Health Study, a cohort of 5,201 males and females aged ≥65 years, and found an increased risk for mortality in the restrictive lung disease group (HR, 1.9; 95% CI, 1.6 to 2.3) compared with the mild obstruction group (HR, 1.4; 95% CI, 1.1 to 1.7) [29]. Therefore, air pollution was more strongly associated with restrictive lung disease than with COPD, and both the restrictive lung disease and COPD groups had increased mortality risk.
- This study had several limitations. First, we only estimated data on the concentrations of specific air pollutants across the country using the KAQFS rather than including real air pollutant measurement concentrations because of the limited number of air-quality monitoring stations. Moreover, the real measurement data cannot fully reflect the air pollution exposure at participants’ residences [15]. The data assimilation method, similar to the KAQFS, could support simultaneous data fusion for multiple pollutants and accurately represent current air quality [30]. Moreover, the effect of interactions between the air pollutants was not considered in this study. As the KNHANES questionnaire did not collect information on residential mobility, we assumed that the participants did not move for 2 years before participating in the survey [19]. This assumption could lead to bias, such as higher estimates for the non-mover group [8]. Lastly, we did not consider participants’ exposure to indoor air pollutants. To determine the effects of exposure to indoor air pollutants, the indoor air quality in household units should be considered.
- Consistent with those of previous studies, our findings indicated that long-term exposure to air pollution was significantly associated with pulmonary function, especially in the restrictive lung disease group, and that pulmonary function was associated with mortality risk in Korea. Although the COPD criteria do not include the restrictive lung disease group, restrictive lung disease needs to be controlled and managed based on its mortality risk. Reducing air pollution is also necessary to enhance pulmonary function.
DISCUSSION
SUPPLEMENTARY MATERIALS
ACKNOWLEDGEMENTS
ACKNOWLEDGEMENTS
-
CONFLICT OF INTEREST
The authors have no conflicts of interest to declare for this study.
-
FUNDING
None.
-
AUTHOR CONTRIBUTIONS
Conceptualization: SBC, KO. Data curation: SY. Formal analysis: SBC, SY, YBP. Funding acquisition: None. Methodology: SBC, SJK, KO. Project administration: KO. Visualization: SBC. Writing – original draft: SBC. Writing – review & editing: SBC, SY, SJK, YBP, KO.
NOTES
| Characteristics | Normal | Restrictive | Mild obstruction | Moderate obstruction | Severe and very severe obstruction | Total |
|---|---|---|---|---|---|---|
| Total (N/weighted N) | 20,598/16,084,557 | 2,995/2,268,300 | 1,761/1,303,355 | 1,833/1,332,349 | 191/142,568 | 27,378/21,131,129 |
|
|
||||||
| Age (yr) | 53.6 (0.1) | 58.5 (0.3) | 64.4 (0.3) | 62.8 (0.3) | 64.3 (0.8) | 55.4 (0.1) |
|
|
||||||
| Sex | ||||||
| Male | 43.3 (0.4) | 52.3 (1.1) | 73.6 (1.2) | 74.7 (1.2) | 76.4 (3.5) | 48.3 (0.3) |
| Female | 56.7 (0.4) | 47.7 (1.1) | 26.4 (1.2) | 25.3 (1.2) | 23.6 (3.5) | 51.7 (0.3) |
|
|
||||||
| Residential area | ||||||
| Urban | 80.0 (0.9) | 78.8 (1.3) | 74.5 (1.6) | 74.3 (1.6) | 65.6 (4.2) | 79.0 (0.9) |
| Rural | 20.0 (0.9) | 21.2 (1.3) | 25.5 (1.6) | 25.7 (1.6) | 34.4 (4.2) | 21.0 (0.9) |
|
|
||||||
| Education level | ||||||
| ≤Elementary school | 23.4 (0.4) | 30.6 (1.1) | 40.8 (1.4) | 39.7 (1.4) | 55.7 (4.3) | 26.5 (0.4) |
| Middle school | 14.2 (0.3) | 15.8 (0.8) | 16.2 (1.0) | 17.9 (1.1) | 19.8 (3.7) | 14.7 (0.3) |
| High school | 34.9 (0.5) | 31.3 (1.1) | 27.5 (1.3) | 26.1 (1.2) | 17.7 (3.3) | 33.4 (0.4) |
| ≥College | 27.5 (0.5) | 22.4 (1.1) | 15.6 (1.0) | 16.2 (1.1) | 6.8 (1.8) | 25.4 (0.5) |
|
|
||||||
| Household income | ||||||
| Lower | 23.2 (0.4) | 24.7 (1.0) | 23.3 (1.2) | 27.5 (1.3) | 35.4 (4.0) | 23.7 (0.4) |
| Lower middle | 25.4 (0.4) | 25.0 (1.0) | 26.7 (1.3) | 24.5 (1.2) | 23.0 (3.6) | 25.4 (0.4) |
| Upper middle | 25.6 (0.4) | 25.1 (1.0) | 26.1 (1.3) | 25.1 (1.2) | 27.3 (4.1) | 25.6 (0.4) |
| Upper | 25.8 (0.5) | 25.2 (1.0) | 23.9 (1.3) | 22.9 (1.2) | 14.3 (2.9) | 25.4 (0.5) |
|
|
||||||
| Smoking status | ||||||
| No | 81.2 (0.4) | 79.8 (0.9) | 70.3 (1.3) | 66.9 (1.3) | 69.4 (4.0) | 79.4 (0.3) |
| Current (≥5 packs in a lifetime) | 18.8 (0.4) | 20.2 (0.9) | 29.7 (1.3) | 33.1 (1.3) | 30.6 (4.0) | 20.6 (0.3) |
|
|
||||||
| Obesity1 | ||||||
| Underweight | 1.3 (0.1) | 1.7 (0.3) | 1.5 (0.5) | 3.6 (0.5) | 10.9 (2.7) | 1.6 (0.1) |
| Normal | 62.3 (0.4) | 45.1 (1.2) | 69.8 (1.4) | 63.7 (1.3) | 64.1 (4.1) | 61.0 (0.4) |
| Obesity | 36.4 (0.4) | 53.2 (1.2) | 28.7 (1.3) | 32.7 (1.3) | 25.0 (3.7) | 37.4 (0.4) |
|
|
||||||
| Temperature (°C)2 | 12.8 (0.3) | 12.0 (0.4) | 12.8 (0.4) | 12.8 (0.4) | 13.2 (0.9) | 12.7 (0.3) |
|
|
||||||
| Relative humidity (%) | 68.2 (0.3) | 67.9 (0.5) | 68.8 (0.5) | 69.0 (0.5) | 68.5 (1.4) | 68.3 (0.3) |
|
|
||||||
| Pollutant 2-yr lag3 | ||||||
| PM10 (μg/m3) | 50.2 (0.1) | 50.5 (0.2) | 49.6 (0.2) | 50.2 (0.2) | 49.2 (0.6) | 50.2 (0.1) |
| PM2.5 (μg/m3) | 25.3 (0.1) | 25.5 (0.1) | 25.2 (0.1) | 25.4 (0.1) | 25.3 (0.4) | 25.3 (0.1) |
| SO2 (ppb) | 5.0 (0.0) | 4.9 (0.0) | 5.0 (0.1) | 5.0 (0.1) | 4.7 (0.2) | 5.0 (0.0) |
| NO2 (ppb) | 24.1 (0.1) | 23.9 (0.3) | 23.2 (0.3) | 23.4 (0.3) | 21.0 (0.8) | 24.0 (0.1) |
| CO (ppb) | 492.6 (1.6) | 497.0 (2.7) | 480.9 (3.3) | 488.1 (2.8) | 472.1 (8.9) | 491.9 (1.5) |
| O3 (ppb) | 24.6 (0.1) | 24.6 (0.1) | 25.0 (0.1) | 24.7 (0.1) | 25.4 (0.3) | 24.7 (0.1) |
|
|
||||||
| Pulmonary function4 | 76.1 (0.3) | 10.7 (0.2) | 6.2 (0.2) | 6.3 (0.2) | 0.7 (0.1) | - |
| FVC (L) | 3.6 (0.0) | 2.8 (0.0) | 4.0 (0.0) | 3.3 (0.0) | 2.6 (0.1) | 3.5 (0.0) |
| FVCp (%) | 95.3 (0.1) | 74.0 (0.1) | 100.0 (0.3) | 82.7 (0.3) | 65.9 (1.0) | 92.3 (0.1) |
| FEV1 (L) | 2.9 (0.0) | 2.3 (0.0) | 2.6 (0.0) | 2.1 (0.0) | 1.2 (0.0) | 2.7 (0.0) |
| FEV1p (%) | 96.0 (0.1) | 77.5 (0.2) | 90.5 (0.2) | 69.4 (0.2) | 41.0 (0.6) | 91.6 (0.1) |
| FEV1/FVC | 0.8 (0.0) | 0.8 (0.0) | 0.7 (0.0) | 0.6 (0.0) | 0.5 (0.0) | 0.8 (0.0) |
Values are presented as mean (standard error) for continuous variables or % (standard error of %) for categorical variables.
PM10, particulate matter less than 10 μm in diameter; PM2.5, particulate matter less than 2.5 μm in diameter; SO2, sulfur dioxide; NO2, nitrogen oxide; CO, carbon monoxide; O3, ozone; ppb, parts per billion; BMI, body mass index; FVC, forced vital capacity; FVCp, percent predicted FVC; FEV1, forced expiratory volume in 1 second; FEV1p, percent predicted FEV1.
1 BMI <18.5 kg/m2 was classified as underweight, and BMI ≥25.0 kg/m2 was classified as obesity.
2 Temperature and relative humidity were measured in the residential area at the date of the survey.
3 Exposure to each pollutant with a 2-year lag was defined as the mean value of the time-series data for each air pollutant at the residential address from 2 years before the survey date.
4 The pulmonary function groups were defined as follows: normal (FEV1/FVC ≥0.7 and FVCp ≥80%), restrictive (FEV1/FVC ≥0.7 and FVCp <80%), mild obstruction (FEV1/FVC <0.7 and FEV1p ≥80%), moderate obstruction (FEV1/FVC <0.7 and 50≤FEV1p<80%), and severe and very severe obstruction (FEV1/FVC <0.7 and FEV1p <50%).
| Variables | Model3 | Pulmonary function, OR (95% CI) | p for trend1 | |||
|---|---|---|---|---|---|---|
|
|
||||||
| Q1 | Q2 | Q3 | Q4 | |||
| PM10 median (Max) (μg/m3) | 43.3 (46.2) | 47.9 (49.2) | 51.4 (53.7) | 57.7 (72.9) | ||
| Total | Restrictive | 1.000 (reference) | 0.947 (0.811, 1.105) | 0.966 (0.830, 1.124) | 1.203 (1.036, 1.396) | 0.011 |
| COPD | 1.000 (reference) | 0.984 (0.857, 1.129) | 1.070 (0.931, 1.230) | 1.086 (0.945, 1.247) | 0.137 | |
| ≥Moderate obstruction | 1.000 (reference) | 1.036 ([0.876, 1.226) | 1.109 (0.939, 1.309) | 1.189 (1.009, 1.401) | 0.028 | |
| Male | Restrictive | 1.000 (reference) | 1.018 (0.830, 1.249) | 0.865 (0.697, 1.073) | 1.272 (1.044, 1.551) | 0.052 |
| COPD | 1.000 (reference) | 1.020 (0.859, 1.211) | 1.077 (0.905, 1.282) | 1.038 (0.872, 1.236) | 0.557 | |
| ≥Moderate obstruction | 1.000 (reference) | 1.057 (0.859, 1.301) | 1.082 (0.882, 1.326) | 1.135 (0.921, 1.398) | 0.236 | |
| Female | Restrictive | 1.000 (reference) | 0.879 (0.710, 1.088) | 1.075 (0.876, 1.320) | 1.140 (0.928, 1.401) | 0.060 |
| COPD | 1.000 (reference) | 0.895 (0.717, 1.117) | 1.044 (0.835, 1.304) | 1.197 (0.945, 1.516) | 0.067 | |
| ≥Moderate obstruction | 1.000 (reference) | 0.980 (0.730, 1.315) | 1.167 (0.875, 1.556) | 1.354 (0.998, 1.837) | 0.027 | |
| Non-smokers4 | Restrictive | 1.000 (reference) | 0.905 (0.765, 1.071) | 0.948 (0.805, 1.115) | 1.139 (0.968, 1.339) | 0.078 |
| COPD | 1.000 (reference) | 0.961 (0.824, 1.120) | 1.047 (0.896, 1.224) | 1.132 (0.967, 1.327) | 0.072 | |
| ≥Moderate obstruction | 1.000 (reference) | 1.053 (0.866, 1.282) | 1.198 (0.988, 1.452) | 1.320 (1.091, 1.598) | 0.002 | |
| Current smokers5 | Restrictive | 1.000 (reference) | 1.165 (0.824, 1.649) | 1.061 (0.749, 1.504) | 1.493 (1.082, 2.060) | 0.023 |
| COPD | 1.000 (reference) | 1.025 (0.783, 1.342) | 1.099 (0.844, 1.433) | 0.964 (0.747, 1.245) | 0.863 | |
| ≥Moderate obstruction | 1.000 (reference) | 0.994 (0.721, 1.371) | 0.901 (0.654, 1.240) | 0.921 (0.675, 1.256) | 0.506 | |
|
|
||||||
| PM2.5 median (Max) (μg/m3) | 22.1 (23.3) | 24.1 (25.0) | 25.8 (26.9) | 29.0 (38.8) | ||
| Total | Restrictive | 1.000 (reference) | 1.125 (0.969, 1.307) | 1.105 (0.948, 1.289) | 1.283 (1.101, 1.495) | 0.003 |
| COPD | 1.000 (reference) | 1.029 (0.897, 1.181) | 1.120 (0.972, 1.291) | 1.039 (0.908, 1.189) | 0.362 | |
| ≥Moderate obstruction | 1.000 (reference) | 1.090 (0.921, 1.291) | 1.137 (0.958, 1.350) | 1.136 (0.962, 1.342) | 0.116 | |
| Male | Restrictive | 1.000 (reference) | 1.090 (0.884, 1.343) | 1.080 (0.874, 1.335) | 1.290 (1.044, 1.595) | 0.026 |
| COPD | 1.000 (reference) | 1.079 (0.909, 1.282) | 1.091 (0.911, 1.307) | 1.005 (0.849, 1.190) | 0.918 | |
| ≥Moderate obstruction | 1.000 (reference) | 1.157 (0.935, 1.431) | 1.107 (0.894, 1.372) | 1.134 (0.919, 1.399) | 0.326 | |
| Female | Restrictive | 1.000 (reference) | 1.148 (0.944, 1.396) | 1.119 (0.910, 1.376) | 1.270 (1.045, 1.543) | 0.027 |
| COPD | 1.000 (reference) | 0.922 (0.724, 1.175) | 1.167 (0.942, 1.446) | 1.107 (0.883, 1.389) | 0.146 | |
| ≥Moderate obstruction | 1.000 (reference) | 0.944 (0.689, 1.292) | 1.186 (0.892, 1.577) | 1.148 (0.851, 1.548) | 0.189 | |
| Non-smokers4 | Restrictive | 1.000 (reference) | 1.150 (0.981, 1.350) | 1.117 (0.947, 1.316) | 1.259 (1.072, 1.478) | 0.010 |
| COPD | 1.000 (reference) | 1.027 (0.878, 1.201) | 1.118 (0.955, 1.309) | 1.068 (0.914, 1.247) | 0.259 | |
| ≥Moderate obstruction | 1.000 (reference) | 1.080 (0.887, 1.315) | 1.163 (0.956, 1.414) | 1.174 (0.971, 1.419) | 0.070 | |
| Current smokers5 | Restrictive | 1.000 (reference) | 1.009 (0.712, 1.431) | 1.028 (0.734, 1.439) | 1.341 (0.958, 1.877) | 0.085 |
| COPD | 1.000 (reference) | 1.007 (0.769, 1.320) | 1.118 (0.850, 1.471) | 0.951 (0.734, 1.232) | 0.886 | |
| ≥Moderate obstruction | 1.000 (reference) | 1.090 (0.774, 1.534) | 1.068 (0.762, 1.498) | 1.024 (0.737, 1.423) | 0.948 | |
|
|
||||||
| NO2 median (Max) (ppb) | 12.0 (16.3) | 18.8 (21.3) | 25.9 (32.0) | 35.5 (41.2) | ||
| Total | Restrictive | 1.000 (reference) | 0.932 (0.788, 1.102) | 0.935 (0.794, 1.101) | 0.951 (0.798, 1.133) | 0.681 |
| COPD | 1.000 (reference) | 0.988 (0.853, 1.146) | 1.082 (0.928, 1.261) | 1.154 (0.988, 1.348) | 0.031 | |
| ≥Moderate obstruction | 1.000 (reference) | 1.060 (0.889, 1.263) | 1.112 (0.927, 1.334) | 1.187 (0.979, 1.439) | 0.075 | |
| Male | Restrictive | 1.000 (reference) | 0.845 (0.669, 1.067) | 0.920 (0.733, 1.154) | 0.892 (0.695, 1.144) | 0.610 |
| COPD | 1.000 (reference) | 0.994 (0.829, 1.191) | 1.043 (0.870, 1.250) | 1.134 (0.935, 1.376) | 0.151 | |
| ≥Moderate obstruction | 1.000 (reference) | 1.088 (0.876, 1.351) | 1.041 (0.836, 1.297) | 1.206 (0.949, 1.532) | 0.195 | |
| Female | Restrictive | 1.000 (reference) | 1.040 (0.846, 1.280) | 0.955 (0.775, 1.176) | 1.029 (0.824, 1.285) | 0.978 |
| COPD | 1.000 (reference) | 0.982 (0.766, 1.259) | 1.164 (0.867, 1.562) | 1.203 (0.911, 1.588) | 0.096 | |
| ≥Moderate obstruction | 1.000 (reference) | 1.014 (0.735, 1.400) | 1.281 (0.901, 1.822) | 1.183 (0.824, 1.696) | 0.200 | |
| Non-smokers4 | Restrictive | 1.000 (reference) | 0.983 (0.826, 1.171) | 0.962 (0.812, 1.141) | 0.976 (0.814, 1.169) | 0.762 |
| COPD | 1.000 (reference) | 1.148 (0.972, 1.355) | 1.144 (0.955, 1.371) | 1.331 (1.113, 1.593) | 0.004 | |
| ≥Moderate obstruction | 1.000 (reference) | 1.222 (0.992, 1.506) | 1.201 (0.967, 1.493) | 1.384 (1.105, 1.733) | 0.012 | |
| Current smokers5 | Restrictive | 1.000 (reference) | 0.735 (0.511, 1.057) | 0.827 (0.575, 1.189) | 0.860 (0.576, 1.284) | 0.773 |
| COPD | 1.000 (reference) | 0.674 (0.506, 0.898) | 0.930 (0.699, 1.237) | 0.801 (0.592, 1.084) | 0.698 | |
| ≥Moderate obstruction | 1.000 (reference) | 0.758 (0.538, 1.069) | 0.924 (0.659, 1.295) | 0.841 (0.575, 1.230) | 0.731 | |
|
|
||||||
| CO median (Max) (ppb) | 373.7 (415.2) | 454.3 (500.8) | 531.9 (555.1) | 588.0 (865.1) | ||
| Total | Restrictive | 1.000 (reference) | 1.004 (0.861, 1.169) | 0.995 (0.855, 1.157) | 1.292 (1.110, 1.504) | 0.001 |
| COPD | 1.000 (reference) | 0.925 (0.803, 1.067) | 1.001 (0.873, 1.149) | 1.027 (0.892, 1.182) | 0.501 | |
| ≥Moderate obstruction | 1.000 (reference) | 1.074 (0.905, 1.275) | 1.113 (0.942, 1.315) | 1.140 (0.956, 1.358) | 0.135 | |
| Male | Restrictive | 1.000 (reference) | 0.964 (0.784, 1.186) | 1.029 (0.828, 1.278) | 1.273 (1.029, 1.577) | 0.018 |
| COPD | 1.000 (reference) | 0.953 (0.800, 1.135) | 1.010 (0.847, 1.203) | 0.989 (0.829, 1.179) | 0.941 | |
| ≥Moderate obstruction | 1.000 (reference) | 1.097 (0.887, 1.356) | 1.122 (0.913, 1.380) | 1.079 (0.866, 1.344) | 0.479 | |
| Female | Restrictive | 1.000 (reference) | 1.043 (0.852, 1.277) | 0.961 (0.786, 1.175) | 1.322 (1.091, 1.602) | 0.013 |
| COPD | 1.000 (reference) | 0.860 (0.682, 1.085) | 0.972 (0.775, 1.218) | 1.112 (0.866, 1.429) | 0.308 | |
| ≥Moderate obstruction | 1.000 (reference) | 1.011 (0.755, 1.354) | 1.064 (0.792, 1.428) | 1.294 (0.939, 1.783) | 0.121 | |
| Non-smokers4 | Restrictive | 1.000 (reference) | 1.042 (0.882, 1.230) | 0.997 (0.848, 1.171) | 1.320 (1.125, 1.547) | 0.002 |
| COPD | 1.000 (reference) | 1.000 (0.856, 1.169) | 1.042 (0.894, 1.214) | 1.121 (0.952, 1.320) | 0.150 | |
| ≥Moderate obstruction | 1.000 (reference) | 1.217 (1.004, 1.474) | 1.239 (1.022, 1.502) | 1.306 (1.069, 1.596) | 0.012 | |
| Current smokers5 | Restrictive | 1.000 (reference) | 0.853 (0.608, 1.198) | 0.998 (0.712, 1.400) | 1.197 (0.847, 1.693) | 0.182 |
| COPD | 1.000 (reference) | 0.759 (0.582, 0.989) | 0.908 (0.686, 1.200) | 0.814 (0.624, 1.063) | 0.304 | |
| ≥Moderate obstruction | 1.000 (reference) | 0.801 (0.581, 1.104) | 0.884 (0.641, 1.218) | 0.836 (0.602, 1.160) | 0.404 | |
OR, odds ratio; CI, confidence interval; Max, maximum; Q, quartile; PM10, particulate matter less than 10 μm in diameter; PM2.5, particulate matter less than 2.5 μm in diameter; NO2, nitrogen oxide; CO, carbon monoxide; ppb, parts per billion; COPD, chronic obstructive pulmonary disease.
1 Model for restrictive lung disease: normal as a reference (total, n=20,598; male, n=7,782; female, n=12,816; non-smokers, n=17,408; current smokers, n=3,190) and the restrictive lung disease group as the event (total, n=2,995; male, n=1,439; female, n=1,556; non-smokers, n=2,480; current smokers, n=515) as the dependent variable; Model for COPD: normal as reference versus COPD as the event (total, n=3,785; male, n=2,759; female, n=1,026; non-smokers, n=2,681; current smokers, n=1,104); Model for ≥moderate obstruction: normal as reference and moderate, severe, and very severe obstruction groups as the event (total, n=2,024; male, n=1,475; female, n=549; non-smokers, n=1,413; current smokers, n=611).
2 The covariates were age, sex, residential area, education level, household income, smoking status, obesity, temperature, and relative humidity.
3 Linear trend for air pollution.
4 Non-smokers were those who indicated ‘no’ in response to items asking whether individuals had a lifetime cigarette smoking history of 5 packs or more and currently smoked.
5 Current smokers were those who indicated ‘yes’ in response to items asking whether individuals had a lifetime cigarette smoking history of 5 packs or more and currently smoked.
| Variables (lag period)2 | FVCp | FEV1p | FEV1/FVC | |||
|---|---|---|---|---|---|---|
|
|
|
|
||||
| Beta | p-value | Beta | p-value | Beta | p-value | |
| PM10 (2 yr) | ||||||
| Q2 | −0.041 | 0.886 | 0.178 | 0.573 | 0.002 | 0.145 |
| Q3 | −0.311 | 0.256 | −0.275 | 0.363 | 0.000 | 0.797 |
| Q4 | −0.928 | 0.001 | −0.672 | 0.027 | 0.002 | 0.269 |
|
|
||||||
| PM2.5 (2 yr) | ||||||
| Q2 | −0.524 | 0.059 | −0.600 | 0.052 | −0.001 | 0.471 |
| Q3 | −0.282 | 0.306 | −0.659 | 0.032 | −0.003 | 0.028 |
| Q4 | −1.290 | <0.001 | −1.205 | <0.001 | 0.000 | 0.990 |
|
|
||||||
| NO2 (2 yr) | ||||||
| Q2 | −0.310 | 0.333 | −0.404 | 0.232 | 0.000 | 0.872 |
| Q3 | −0.343 | 0.260 | −0.592 | 0.076 | −0.001 | 0.405 |
| Q4 | −0.509 | 0.118 | −0.864 | 0.014 | −0.003 | 0.165 |
|
|
||||||
| CO (2 yr) | ||||||
| Q2 | −0.815 | 0.004 | −0.608 | 0.056 | 0.002 | 0.326 |
| Q3 | −0.828 | 0.002 | −0.851 | 0.005 | 0.000 | 0.906 |
| Q4 | −1.460 | <0.001 | −1.128 | <0.001 | 0.002 | 0.115 |
PM10, particulate matter less than 10 μm in diameter; PM2.5, particulate matter less than 2.5 μm in diameter; NO2, nitrogen oxide; CO, carbon monoxide; FVC, forced vital capacity; FVCp, percent predicted FVC; FEV1, forced expiratory volume in 1 second; FEV1p, percent predicted FEV1; Q, quartile.
1 Linear regression model shows beta coefficients and p-values for pulmonary function groups after adjustment for age, sex, residential area, education level, household income, smoking status, obesity, temperature, and relative humidity.
2 The air pollution variables were categorized into quartiles, and the first quartile was the reference group.
| Variables | HR (95% CI) | p-value |
|---|---|---|
| Age (yr) | 1.114 (1.105, 1.123) | <0.001 |
|
|
||
| Sex | ||
| Male | 1.791 (1.543, 2.078) | <0.001 |
| Female | 1.000 (reference) | |
|
|
||
| Residential area | ||
| Urban | 1.000 (reference) | |
| Rural | 1.038 (0.906, 1.190) | 0.587 |
|
|
||
| Education level | ||
| ≤Elementary school | 1.000 (reference) | |
| Middle school | 0.949 (0.790, 1.140) | 0.576 |
| High school | 0.830 (0.692, 0.995) | 0.044 |
| ≥College | 0.669 (0.521, 0.858) | 0.002 |
|
|
||
| Household income | ||
| Lower | 1.000 (reference) | |
| Lower middle | 0.776 (0.658, 0.914) | 0.003 |
| Upper middle | 0.605 (0.507, 0.722) | <0.001 |
| Upper | 0.716 (0.599, 0.857) | <0.001 |
|
|
||
| Smoking status | ||
| No | 1.000 (reference) | |
| Current (≥5 packs in a lifetime) | 1.625 (1.391, 1.897) | <0.001 |
|
|
||
| Obesity | ||
| Underweight | 1.591 (1.164, 2.174) | 0.004 |
| Normal | 1.000 (reference) | |
| Obesity | 0.841 (0.732, 0.966) | 0.015 |
|
|
||
| Temperature (°C) | 1.004 (0.998, 1.011) | 0.199 |
|
|
||
| Relative humidity (%) | 0.996 (0.991, 1.001) | 0.091 |
|
|
||
| Pulmonary function2 | ||
| Normal | 1.000 (reference) | |
| Restrictive | 1.585 (1.332, 1.886) | <0.001 |
| Mild obstruction | 1.278 (1.052, 1.551) | 0.013 |
| Moderate obstruction | 1.415 (1.170, 1.710) | <0.001 |
| Severe and very severe obstruction | 1.896 (1.293, 2.782) | 0.001 |
FVC, forced vital capacity; FVCp, percent predicted FVC; FEV1, forced expiratory volume in 1 second; FEV1p, percent predicted FEV1.
1 Cox models show hazard ratios for pulmonary function groups after adjustment for age, sex, residential area, education level, household income, smoking status, obesity, temperature, and relative humidity.
2 The pulmonary function groups were defined as follows: normal (FEV1/FVC ≥0.7 and FVCp ≥80%), restrictive (FEV1/FVC ≥0.7 and FVCp < 80%), mild obstruction (FEV1/FVC <0.7 and FEV1p ≥80%), moderate obstruction (FEV1/FVC <0.7 and 50≤FEV1p<80%), and severe and very severe obstruction (FEV1/FVC <0.7 and FEV1p <50%).
- 1. Diaz-Guzman E, Mannino DM. Epidemiology and prevalence of chronic obstructive pulmonary disease. Clin Chest Med 2014;35:7-16.ArticlePubMed
- 2. Korea Center for Disease Control and Prevention Agency. 2019 National health statistics. [cited 2021 Apr 30]. Available from: https://knhanes.kdca.go.kr/knhanes/sub04/sub04_04_01.do (Korean).
- 3. Ko FW, Hui DS. Air pollution and chronic obstructive pulmonary disease. Respirology 2012;17:395-401.ArticlePubMed
- 4. Jun T, Min IS. Air pollution, respiratory illness and behavioral adaptation: evidence from South Korea. PLoS One 2019;14:e0221098.ArticlePubMedPMC
- 5. Joo YH, Lee SS, Han KD, Park KH. Association between chronic laryngitis and particulate matter based on the Korea National Health and Nutrition Examination Survey 2008–2012. PLoS One 2015;10:e0133180.ArticlePubMedPMC
- 6. Gan WQ, FitzGerald JM, Carlsten C, Sadatsafavi M, Brauer M. Associations of ambient air pollution with chronic obstructive pulmonary disease hospitalization and mortality. Am J Respir Crit Care Med 2013;187:721-727.ArticlePubMed
- 7. Guerra S, Sherrill DL, Venker C, Ceccato CM, Halonen M, Martinez FD. Morbidity and mortality associated with the restrictive spirometric pattern: a longitudinal study. Thorax 2010;65:499-504.ArticlePubMed
- 8. Kim H, Byun G, Choi Y, Kim S, Kim SY, Lee JT. Effects of long-term exposure to air pollution on all-cause mortality and cause-specific mortality in seven major cities of South Korea: Korean national health and nutritional examination surveys with mortality follow-up. Environ Res 2021;192:110290.ArticlePubMed
- 9. Choi HS, Oh HJ, Choi H, Choi WH, Kim JG, Kim KM, et al. Vitamin D insufficiency in Korea--a greater threat to younger generation: the Korea National Health and Nutrition Examination Survey (KNHANES) 2008. J Clin Endocrinol Metab 2011;96:643-651.ArticlePubMed
- 10. Kim SD. Association between sitting time and orthopedic conditions in Korean older adults. Geriatr Nurs 2019;40:629-633.ArticlePubMed
- 11. Yoo KH, Kim YS, Sheen SS, Park JH, Hwang YI, Kim SH, et al. Prevalence of chronic obstructive pulmonary disease in Korea: the fourth Korean National Health and Nutrition Examination Survey, 2008. Respirology 2011;16:659-665.ArticlePubMed
- 12. Vogelmeier CF, Criner GJ, Martinez FJ, Anzueto A, Barnes PJ, Bourbeau J, et al. Global strategy for the diagnosis, management, and prevention of chronic obstructive lung disease 2017 report. GOLD executive summary. Am J Respir Crit Care Med 2017;195:557-582.ArticlePubMed
- 13. Hwang MJ, Kim JH, Koo YS, Yun HY, Cheong HK. Impacts of ambient air pollution on glucose metabolism in Korean adults: a Korea National Health and Nutrition Examination Survey study. Environ Health 2020;19:70.ArticlePubMedPMC
- 14. Choi DR, Yun HY, Koo YS. A development of air quality forecasting system with data assimilation using surface measurements in East Asia. J Korean Soc Atmos Environ 2019;35:60-85 (Korean)..Article
- 15. Hwang MJ, Cheong HK, Kim JH, Koo YS, Yun HY. Ambient air quality and subjective stress level using Community Health Survey data in Korea. Epidemiol Health 2018;40:e2018028.ArticlePubMedPMC
- 16. Air Korea. Real-time air quality. [cited 2021 Apr 30]. Available from: https://www.airkorea.or.kr/eng/currentAirQuality?pMENU_NO=68 .
- 17. Hwang MJ, Sung J, Yoon M, Kim JH, Yun HY, Choi DR, et al. Establishment of the Korea National Health and Nutrition Examination Survey air pollution study dataset for the researchers on the health impact of ambient air pollution. Epidemiol Health 2021;43:e2021015.ArticlePubMedPMC
- 18. Park H, Jung SY, Lee K, Bae WK, Lee K, Han JS, et al. Prevalence of chronic obstructive lung disease in Korea using data from the fifth Korea national health and nutrition examination survey. Korean J Fam Med 2015;36:128-134.ArticlePubMedPMC
- 19. Park SW, Kim BG, Kim JW, Park JW, Kim JI. A cross-sectional study on the pulmonary function of residents in two urban areas with different PM10 concentrations: data from the fourth Korea national health and nutrition examination survey (KNHANES) 2007–2009. Ann Occup Environ Med 2018;30:47.ArticlePubMedPMC
- 20. Kodia K, Stephens-McDonnough JA, Alnajar A, Villamizar NR, Nguyen DM. Implementation of an enhanced recovery after thoracic surgery care pathway for thoracotomy patients-achieving better pain control with less (schedule II) opioid utilization. J Thorac Dis 2021;13:3948-3959.ArticlePubMedPMC
- 21. Ministry of Environment. Atmospheric environment standards. [2021 Apr 30]. Available from: https://www.me.go.kr/mamo/web/index.do?menuId=586 (Korean)..
- 22. Kwon SO, Hong SH, Han YJ, Bak SH, Kim J, Lee MK, et al. Long-term exposure to PM10 and NO2 in relation to lung function and imaging phenotypes in a COPD cohort. Respir Res 2020;21:247.ArticlePubMedPMC
- 23. Nakao M, Ishihara Y, Kim CH, Hyun IG. The impact of air pollution, including Asian sand dust, on respiratory symptoms and health-related quality of life in outpatients with chronic respiratory disease in Korea: a panel study. J Prev Med Public Health 2018;51:130-139.ArticlePubMedPMC
- 24. Ali R. Effect of diesel emissions on human health: a review. Int J Appl Eng Res 2011;6:1333-1342.
- 25. de Jong K, Vonk JM, Zijlema WL, Stolk RP, van der Plaat DA, Hoek G, et al. Air pollution exposure is associated with restrictive ventilatory patterns. Eur Respir J 2016;48:1221-1224.ArticlePubMed
- 26. Gauderman WJ, Urman R, Avol E, Berhane K, McConnell R, Rappaport E, et al. Association of improved air quality with lung development in children. N Engl J Med 2015;372:905-913.ArticlePubMedPMC
- 27. Berend N. Contribution of air pollution to COPD and small airway dysfunction. Respirology 2016;21:237-244.ArticlePubMed
- 28. Garcia-Aymerich J, Serra Pons I, Mannino DM, Maas AK, Miller DP, Davis KJ. Lung function impairment, COPD hospitalisations and subsequent mortality. Thorax 2011;66:585-590.ArticlePubMed
- 29. Mannino DM, Sonia Buist A, Vollmer WM. Chronic obstructive pulmonary disease in the older adult: what defines abnormal lung function? Thorax 2007;62:237-241.ArticlePubMed
- 30. Xing J, Li S, Ding D, Kelly JT, Wang S, Jang C, et al. Data assimilation of ambient concentrations of multiple air pollutants using an emission-concentration response modeling framework. Atmosphere (Basel) 2020;11:10.3390/atmos11121289.Article
REFERENCES
Figure & Data
References
Citations
- Joint effect of long-term exposure to ambient air pollution on the prevalence of chronic obstructive pulmonary disease using the Korea National Health and Nutrition Examination Survey 2010–2019
Eunjin Kwon, Taiyue Jin, Young-Ah You, Byungmi Kim
Chemosphere.2024; 358: 142137. CrossRef - PM10-bound Microplastics and Trace Metals: A Public Health Insights in the Korean Subway and Indoor Environment
Debananda Roy, Jayun Kim, Minjoo Lee, Seunga Kim, Joonhong Park
Journal of Hazardous Materials.2024; : 135156. CrossRef - Airborne Exposure of the Cornea to PM10 Induces Oxidative Stress and Disrupts Nrf2 Mediated Anti-Oxidant Defenses
Mallika Somayajulu, Sharon A. McClellan, Robert Wright, Ahalya Pitchaikannu, Bridget Croniger, Kezhong Zhang, Linda D. Hazlett
International Journal of Molecular Sciences.2023; 24(4): 3911. CrossRef
 PubReader
 ePub Link
 Cite
Cite- Figure
-

- Related articles
-
- Development and validation of the Health Literacy Index for the Community (HLIC) for the Korean National Health and Nutrition and Examination Survey
- Association of healthy lifestyle factors with the risk of hypertension, dyslipidemia, and their comorbidity in Korea: results from the Korea National Health and Nutrition Examination Survey 2019-2021
- Mediating effect of lower extremity muscle on the relationship between obesity and osteoarthritis in middle-aged and elderly women in Korea: based on the 2009-2011 Korea National Health and Nutrition Examination Survey
- Associations of the magnesium depletion score and magnesium intake with diabetes among US adults: an analysis of the National Health and Nutrition Examination Survey 2011-2018
- Folate, vitamin B12, and homocysteine status in the Korean population: data from the 2013-2015 Korea National Health and Nutrition Examination Survey

