
Articles
- Page Path
- HOME > Epidemiol Health > Volume 45; 2023 > Article
-
Original Article
Age-specific findings on lifestyle and trajectories of cognitive function from the Korean Longitudinal Study of Aging -
Seungju Lim1
 , Eunyoung Yoo2, Ickpyo Hong2, Ji-Hyuk Park2
 -
Epidemiol Health 2023;45:e2023098.
DOI: https://doi.org/10.4178/epih.e2023098
Published online: November 2, 2023
1Department of Occupational Therapy, Graduate School, Yonsei University, Wonju, Korea
2Department of Occupational Therapy, College of Software and Digital Healthcare Convergence, Yonsei University, Wonju, Korea
- Correspondence: Ji-Hyuk Park, Department of Occupational Therapy, College of Software and Digital Healthcare Convergence, Yonsei University, 1 Yonseidae-gil, Wonju 26493, Korea, E-mail: otscientist@yonsei.ac.kr
© 2023, Korean Society of Epidemiology
This is an open-access article distributed under the terms of the Creative Commons Attribution License (https://creativecommons.org/licenses/by/4.0/), which permits unrestricted use, distribution, and reproduction in any medium, provided the original work is properly cited.
Abstract
-
OBJECTIVES
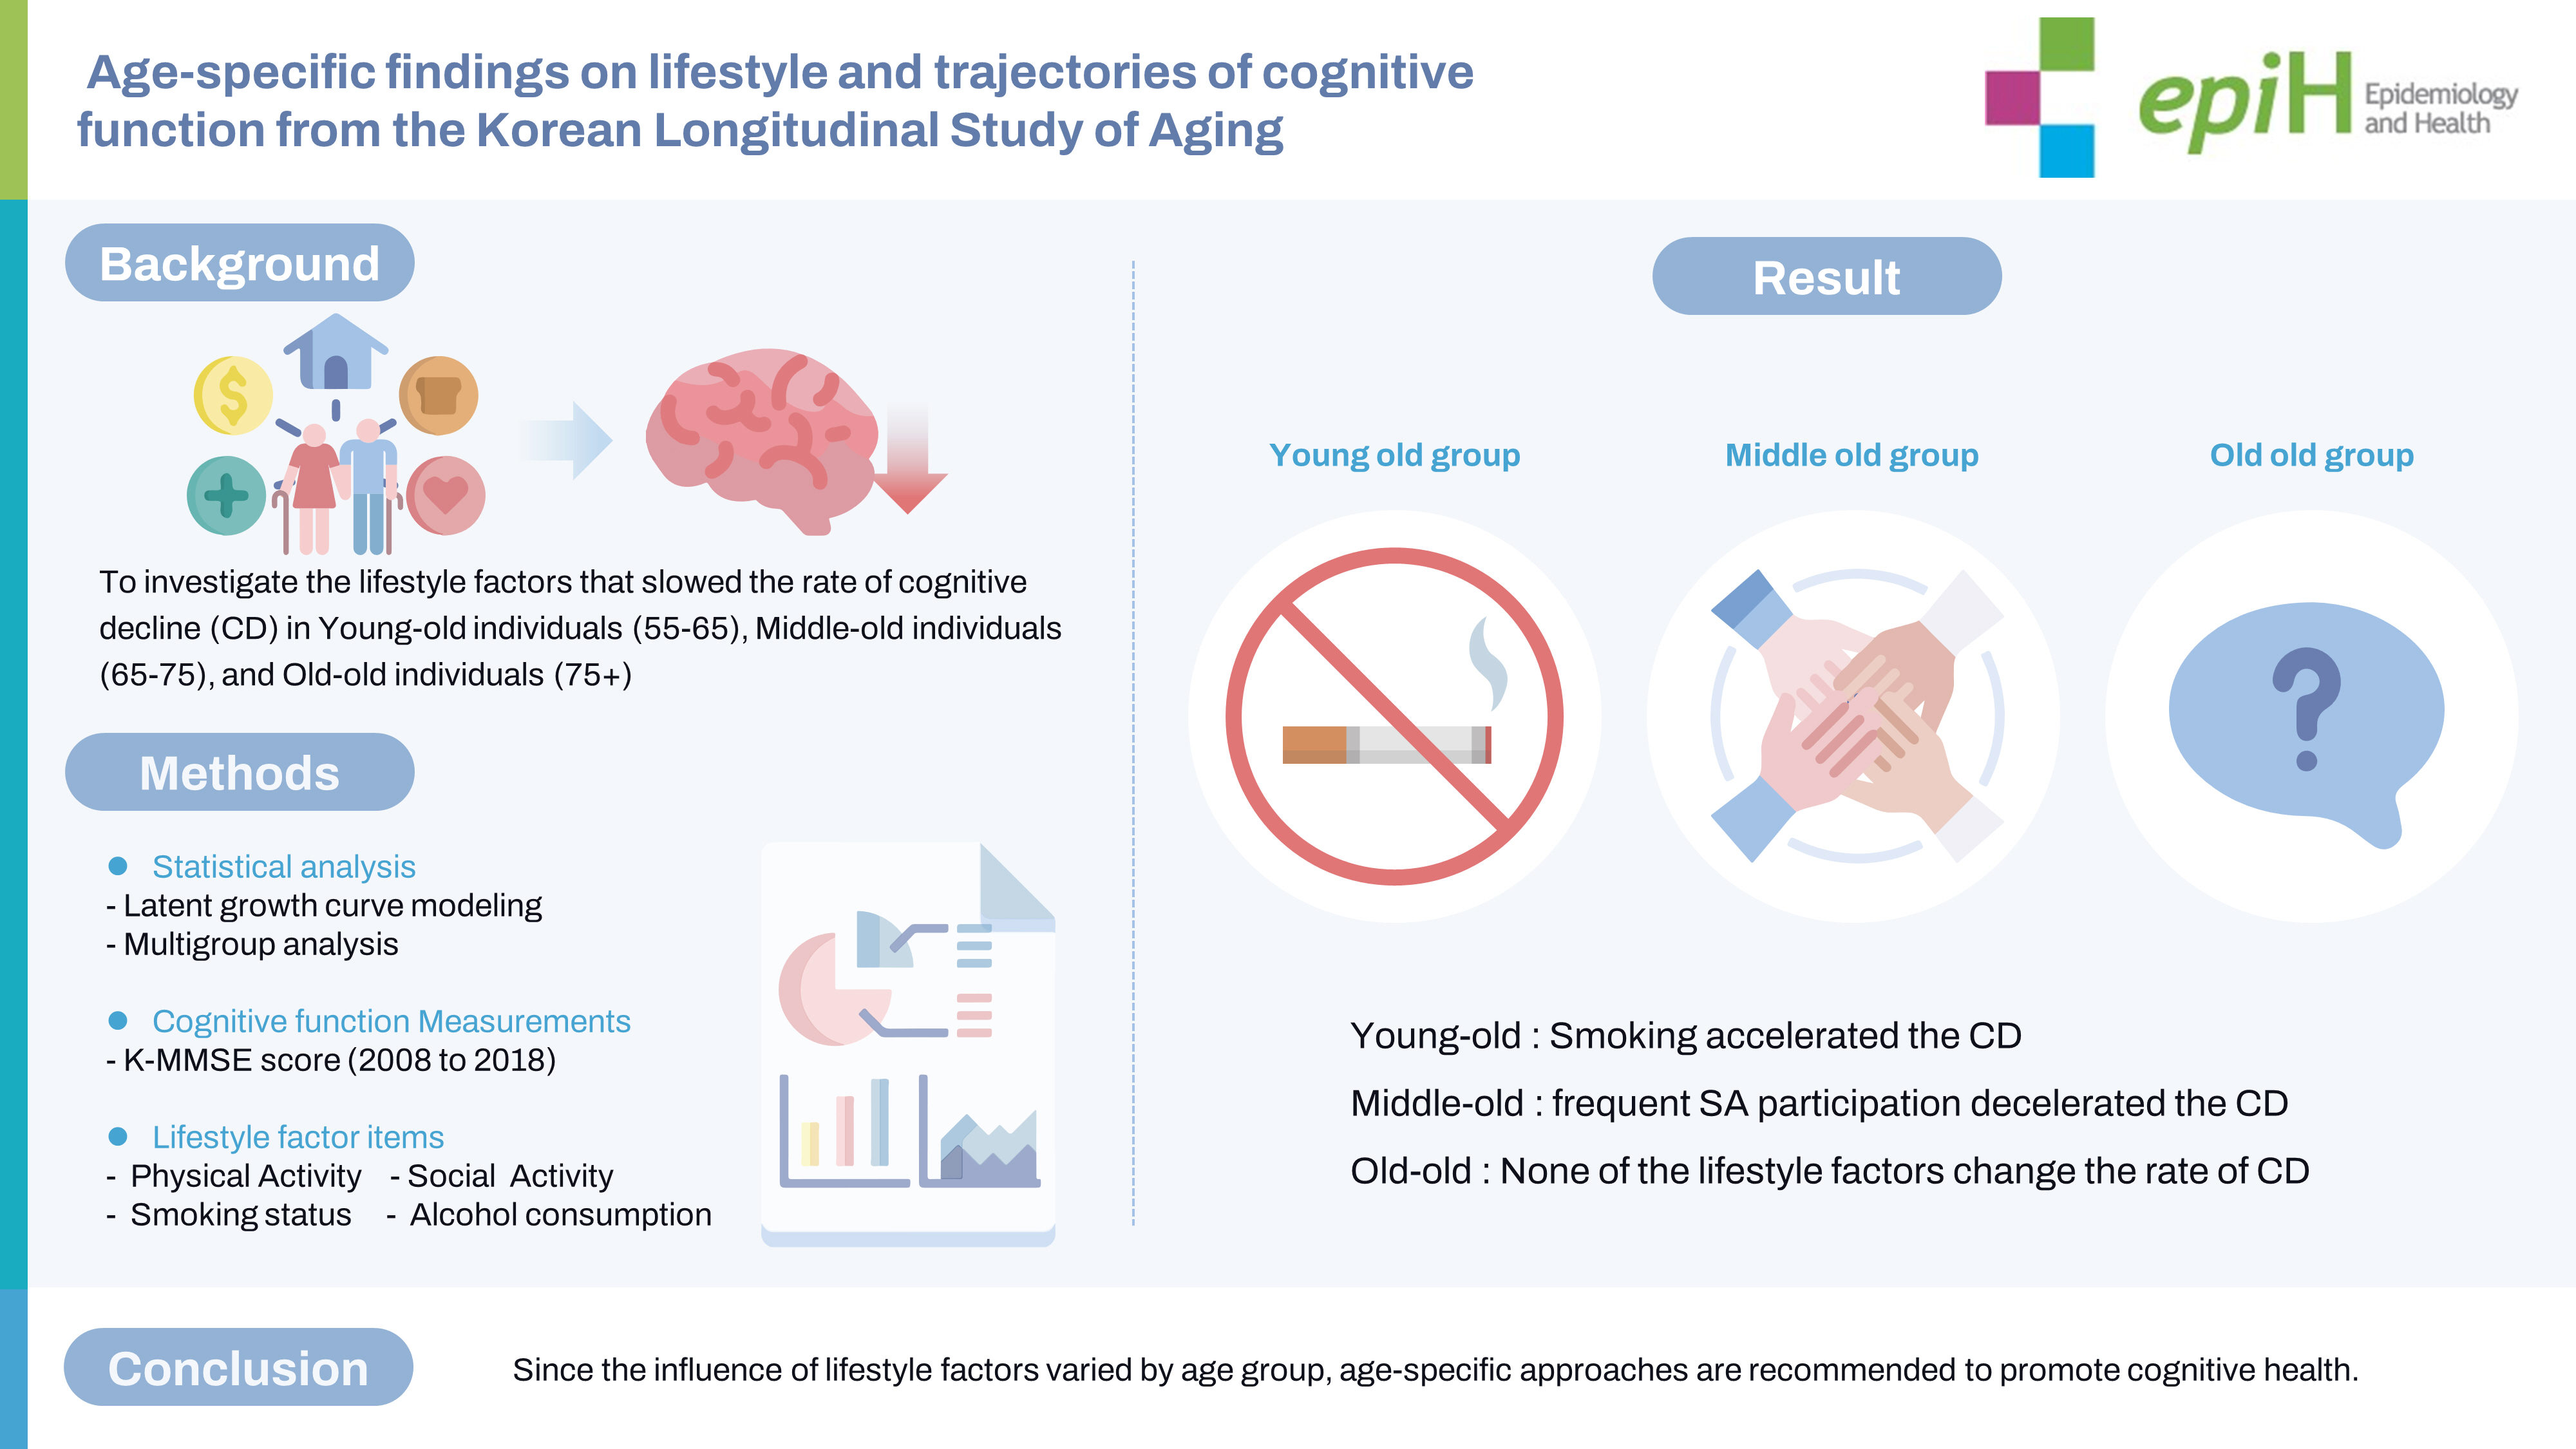
- Few longitudinal studies have explored age-related differences in the relationship between lifestyle factors and cognitive decline. This study investigated lifestyle factors at baseline that slow the longitudinal rate of cognitive decline in young-old (55–64 years), middle-old (65–74 years), and old-old (75+ years) individuals.
-
METHODS
- We conducted an 11-year follow-up that included 6,189 older adults from the Korean Longitudinal Study of Aging, which is a cohort study of community-dwelling older Koreans. Lifestyle factors, including physical activity, social activity (SA), smoking, and alcohol consumption were assessed at baseline. Cognitive function was measured at 2-year intervals over 11 years. Latent growth modeling and multi-group analysis were performed.
-
RESULTS
- The influence of lifestyle factors on the rate of cognitive decline differed by age. Smoking at baseline (−0.05; 95% confidence interval [CI], −0.11 to −0.00, per study wave) accelerated cognitive decline in young-old individuals, whereas frequent participation in SA at baseline (0.02; 95% CI, 0.01 to 0.03, per study wave) decelerated cognitive decline in middle-old individuals. None of the lifestyle factors in this study decelerated cognitive decline in old-old individuals.
-
CONCLUSIONS
- Cognitive strategies based on modifiable lifestyle factors such as smoking cessation in young-old individuals and frequent SA participation in middle-old age individuals may have great potential for preventing cognitive decline. Because the influence of lifestyle factors varied by age group, age-specific approaches are recommended to promote cognitive health.
- Keywords: Life style, Cognition, Longitudinal studies, Aging, Republic of Korea
- Declining cognitive function is a major issue associated with aging [1]. Studies have focused on identifying modifiable lifestyle factors that can preserve cognitive function and prevent cognitive decline in the older population [2]. Lifestyle refers to an individual’s multifaceted health habits [4], including physical activity (PA) [3], social activity (SA) [4], smoking [5], and alcohol consumption habits [6]. Older individuals can maintain their cognitive function during the aging process by adopting healthy lifestyles. According to the “use it or lose it” hypothesis, unhealthy lifestyle behaviors, including sedentary habits, social disengagement, smoking, and alcohol consumption, are related to declining cognitive function compared with healthy lifestyle habits such as exercising, social engagement, non-smoking, and non-drinking [5,6]. However, evidence derived from cross-sectional studies may have a limited ability to support conclusions regarding more complex associations of change [2]. Therefore, longitudinal studies are required to determine the relationship between lifestyle factors and age-related cognitive decline.
- Recent longitudinal studies have reported the impact of lifestyle on cognition. PA at baseline has been associated with the rate of change in cognitive function, and physically inactive older adults reportedly experience a greater decline in cognitive function than the reference group [7,8]. A meta-analysis of longitudinal studies demonstrated a favorable relationship between PA and cognitive trajectories during the follow-up period [9,10]. However, the impact of lifestyle factors such as social engagement, smoking, and alcohol consumption on cognitive decline has not been consistently reported. Some studies have reported that SA at baseline may help delay cognitive decline [11,12], whereas others have failed to demonstrate this [13,14]. Similarly, a reciprocal relationship study [15] reported that cognitive function could modify subsequent changes in confiding and practical social support, but not vice versa. Other lifestyle studies have demonstrated that smoking [16] and alcohol consumption [16] have a significant effect on accelerating the rate of decline in cognitive function, whereas another study showed that global cognition was not associated with alcohol consumption at any point over long periods [17]. Some well-designed randomized controlled trials have also failed to discover any significant effects of PA on cognitive function [18–20]. The varied findings of longitudinal studies may be attributed to the heterogeneity of the elderly population.
- The older population is not a biologically or socially homogeneous group [21]. The rate of cognitive decline accelerates with age, indicating that the slope of decline is steeper in the oldest-old group than in the young-old group [22]. The young-old group reportedly engages more in SA than the oldest-old group because they usually work and have not yet retired [23]. This multifaceted heterogeneity may influence the effects of lifestyle factors on cognitive decline. Target lifestyle factors for preventing dementia have been reported to change according to the lifespan. Education is a modifiable risk factor for dementia in early life, whereas smoking and social isolation are modifiable risk factors in late life [24]. The risk factors for memory decline differ between the young-old and old-old groups [24]. Fewer self-maintenance activities and lower SA are lifestyle risk factors in the young-old and old-old age groups. These findings suggest that lifestyle factors that prevent cognitive decline are diverse and depend on aging [24]. Although evidence regarding the association between lifestyle factors and cognitive function has been reported, it is insufficient to determine which lifestyle factors decelerate cognitive decline in different stages of aging, such as young-old, middle-old, and old-old age groups. Identifying the key lifestyle factors affecting cognitive decline at different stages of aging may be challenging. Latent growth modeling (LGM) is a powerful tool for analyzing the relationship between lifestyle factors and changes in cognitive decline. Therefore, this study investigated lifestyle factors that slow the rate of cognitive decline in different age groups.
INTRODUCTION
- Study sample and procedures
- Data were obtained from the second (2008) to seventh waves (2018) of the Korean Longitudinal Study of Aging (KLoSA), a longitudinal study of community-dwelling older adults at the national level. Since 2006, the Korea Labor Institute has collected data on 10,254 community-dwelling older adults aged ≥45 years from all regions of Korea, except Jeju Island, every 2 years, with an average sample retention rate of 77.6% until 2018 [25]. The KLoSA collects information on health status, PA, SA, and health behaviors. The present study extracted data for approximately 11 years from 2008 to 2018 from the KLoSA database. The exclusion criteria were age <55 years at baseline, missing values for cognitive function at any time point, and missing values for lifestyle factors at baseline. The analysis included 6,189 participants in 2008, and the retention rate of these participants was 85.94% in 2010, 93.38% in 2012, 92.45% in 2014, 93.03% in 2016, and 89.47% in 2018. The study participants were classified into 3 groups according to their baseline age: young-old (55–64 years, n=2,346); middle-old (65–74 years, n=2,407); and old-old (75 years or more, n=1,436).
- Cognitive function
- The cognitive function of study participants over 11 years (2008–2018) was measured using the Korean version of the Mini-Mental State Examination (K-MMSE) [26]. The original version of the K-MMSE is a validated measure of cognitive function in the Korean population [27]. The K-MMSE measures time/spatial orientation, memory registration, attention and calculation, memory recall, language, and visual construction. The questionnaire includes 19 questions with a maximum score of 30 points. Higher scores indicate better cognitive function. In this study, the estimated Cronbach’s alpha was approximately 0.799.
- Lifestyle factors
- The lifestyle factors assessed in this study included PA, SA, smoking status, and alcohol consumption. All lifestyle variables used in this study were measured at baseline (2008). PA at baseline was measured by asking respondents about their regular exercise status and duration. Regular exercise status was assessed by asking participants whether they exercised regularly at least once a week. The responses were dichotomized as 1 (regular exercise) or 0 (no exercise) [2]. The regular exercise duration was assessed by asking respondents how long they had been exercising. The responses were categorized as 0 (none), 1 (<1 year), 2 (1–2 years), 3 (3–4 years), 4 (5–6 years), and 5 (≥7 years) [28]. SA at baseline was measured by inquiring about respondents’ diversity and frequency of SA participation. The diversity of SA participation was assessed by asking if they participated in the following 6 types of SA: (1) religious activities; (2) friendship activities; (3) leisure, culture, or sports clubs; (4) family or school reunions; (5) volunteer work; and (6) political activities. The responses were summed and categorized into 0 (no participation), 1 (one activity), and 2 (≥two activities) [29]. The frequency of SA participation was assessed by asking participants how often they took part in the above activities. Higher scores indicated a higher frequency of SA participation. Alcohol consumption responses were dichotomized as 1 (current drinker) or 0 (never-drinker) [2]. Smoking status responses were also dichotomized as 1 (current smoker) or 0 (never-smoker) [2]. Responses such as “not returned,” “no answer,” “N/A,” and “don’t know” for any of the 6 variables that were being assessed were considered to be missing values and removed.
- Covariates
- All covariates used in this study were measured at baseline (2008). Age, sex, educational level, marital status, residence, log-transformed household income, and employment status were measured. The number of chronic diseases was determined by asking participants if they had been diagnosed with specific conditions: hypertension, diabetes, cancer, pulmonary diseases, hepatic diseases, cardiovascular disease, cerebrovascular diseases, psychiatric diseases, and arthritis. The responses were categorized into 3 categories: 0 (none), 1 (1 disease), and 2 (2 diseases or more) [30]. Self-rated health was measured using a 5-point Likert scale with scores ranging from 1 (very good) to 5 (very bad). Higher scores were reverse-coded to indicate higher self-rated health [2]. Depressive symptoms were measured using an adapted version of the Center for Epidemiologic Studies Depression Scale. The scale consisted of 10 items rated on a 4-point Likert scale from 0 (rarely or none of the time) to 3 (most of the time) [31,32]. Each response was then converted into a binary form, with 0 indicating rarely or none of the time, and 1 indicating sometimes, often, or most of the time [31,32]. Higher summed scores indicated more severe depression.
- Statistical analysis
- Descriptive statistics were used to examine the demographic characteristics of the study participants. LGM and multi-group analyses (MGA) were performed. LGM consists of unconditional and conditional models. First, an unconditional model was used to examine the initial level (i.e., intercept) and rate of change (slope) of cognitive function. To determine the most accurate model for estimating the cognitive trajectory, we conducted the chi-square difference test between the no-growth and linear slope models. Second, MGA was performed among the young-old, middle-old, and old-old groups to examine age-related differences in cognitive trajectories. Third, after verifying the significance of the variance in the intercept and slope of the cognitive trajectories, we applied a conditional model to examine the association between the initial level and rate of change in cognitive function and lifestyle factors, along with the effect of lifestyle factors on the intercept and slope of cognitive function. Lastly, MGA was performed to examine the impact of age differences on lifestyle factors in the cognitive trajectories. The goodness-of-fit of the model was determined using the comparative fit index (CFI; ≥0.90), Tucker-Lewis index (TLI; ≥0.90), root mean square error of approximation (RMSEA; ≥0.06), and standardized root mean square residual (SRMR; ≤0.08) [33]. The chi-square statistic (χ2) was reported in this study but was not used to determine model fit because of its high sensitivity to a large sample size [33]. Missing data were handled using full information maximum likelihood (FIML). Statistical analyses were performed using SPSS version 25.0 (IBM Corp., Armonk, NY, USA), and Mplus 8.8.
- Ethics statement
- This study involved human participants and was conducted in accordance with the principles of the Declaration of Helsinki. The KLoSA was approved by the Korea Labor Institute (approval No. 33602). All participants provided informed consent before the study commencement. The study protocol for secondary data analysis was approved by the Yonsei University Institutional Review Board (approval No. 1041849-202005-SB-067-01).
MATERIALS AND METHODS
- Descriptive results
- The sample comprised 2,346, 2,407, and 1,436 participants in the young-old, middle-old, and old-old groups, respectively. Analysis of variance revealed significant differences in age among the groups, even after post-hoc analysis. Participants in the young-old age group were highly educated, married, wealthier, self-rated as healthier, and had a lower likelihood of being diagnosed with chronic diseases and experiencing depression (Table 1). In addition, participants in the young-old age group were more likely to exercise regularly, participate in SA, smoke, and consume alcohol (Table 2).
- Estimation of cognitive trajectories
- The chi-square difference test was performed between the linear slope and no-growth models to determine the most accurate trajectory shape. Significant differences were observed between the linear slope (χ2 [degree of freedom, df]=274.43 [16], p<0.001; CFI=0.99; TLI=0.99; SRMR=0.02; RMSEA=0.05) and no growth (χ2 [df]=2,077.72 [19], p<0.001; CFI=0.89; TLI=0.89; SRMR=0.19; RMSEA=0.13) models, suggesting that the linear slope models adequately represented the cognitive trajectories.
- An unconditional linear slope model of the LGM was used to identify participants’ cognitive trajectories. Their cognitive trajectories began with a K-MMSE score of 24.32, with a rate of change of −0.20 for a 2-year interval (χ2 [df]=274.43 [16], p<0.001; CFI=0.99; TLI=0.99; SRMR=0.02; RMSEA=0.05). The unconditional LGM with MGA differed significantly according to age group (Δχ2 [df]=356.10 [48], p<0.001; CFI=0.98; TLI=0.98; SRMR=0.04; RMSEA=0.06), with the sharpest declining pattern in time evident in the old-old group. The significance of the covariance of the intercept and slope was observed in the young-old and middle-old groups (Table 3).
- Effects of lifestyle factors on cognitive trajectories
- Conditional LGM was performed to identify the effects of lifestyle factors on the intercepts and slopes of participants’ cognitive function. After adjusting for age group, sex, education, marital status, residence, log transformed household income, employment status, chronic diseases, self-rated health, and depressive symptoms (χ2 [df]=482.61 [76], p<0.001; CFI=0.98; TLI=0.97; SRMR=0.01; RMSEA=0.03), frequency of SA participation at baseline decreased the longitudinal cognitive decline by 0.01. However, smoking at baseline accelerated cognitive decline by −0.05 (Table 4). When considering covariates, older age group had a negative effect (−0.14), while high income and high depressive symptoms had positive effects (0.02 and 0.01, respectively) on the rate of cognitive decline.
- The conditional LGM with MGA showed significant differences according to age group after adjusting for covariates (Δχ2 [df]= 683.52 [240], p<0.001; CFI=0.97; TLI=0.96; SRMR=0.02; RMSEA=0.03). In the young-old group, smoking was associated with accelerated cognitive decline by −0.05 (Table 4). In the middle-old group, frequent participation in SA was the only factor that reduced cognitive decline by 0.02 (Table 4). In the old-old group, none of the lifestyle factors significantly affected cognitive decline (Table 4). When considering covariates, increasing age had a negative effect on cognitive decline in all age groups (young-old: −0.01; middle-old: −0.02; old-old: −0.03). However, being male (0.07), living in a city (0.04), having higher income (0.02), and experiencing high depressive symptoms (0.01) showed a positive effect on the rate of cognitive decline in young-old individuals (Table 4).
RESULTS
- This study was the first to analysis the age-specific effects of lifestyle factors on the cognitive trajectory of the Korean older adults during an 11-year period, using LGM and MGA. This study examined lifestyle factors at baseline that slowed the rate of cognitive decline in different age groups. The results revealed differences in the influence of lifestyle factors on the cognitive decline rate with age. Smoking at baseline accelerated cognitive decline in the young-old group, whereas frequent SA participation at baseline delayed cognitive decline in the middle-old group. None of the lifestyle factors assessed in this study decelerated the cognitive decline in the old-old group.
- In the present study, different lifestyle factors affected the rate of cognitive decline in the young-old and middle-old groups. The results revealed that smoking at baseline was associated with accelerated cognitive decline in the young-old group, whereas frequent participation in SA at baseline was associated with slower cognitive decline in the middle-old group. This finding is consistent with that of a previous study reporting a faster decline in global cognition among individuals in the young-old group who smoked [34]. In the middle-old group, only the frequency of SA participation, not its diversity, slowed cognitive decline. A previous longitudinal systematic review and meta-analysis [35] confirmed that frequent social interactions are important for preventing cognitive decline in middle-old individuals. Although the effects of the diversity and frequency of SA participation on cognitive decline have been widely discussed [36], recent studies have reported that frequency is more sensitive than diversity in predicting cognitive abilities [37]. In particular, individuals in the middle-old group have more time to engage in SA than those in the young-old group because they have retired [23]. The social and biological heterogeneity of the age groups may have resulted in the different effects of lifestyle factors on cognitive decline. In addition, the findings in the old-old group differed from those in the young and middle-old groups.
- We did not identify a significant association between lifestyle factors and cognitive decline in the old-old group, contrary to the findings of previous studies. Some modifiable lifestyle factors (including PA, SA, and health behaviors) have been reported to be predictors of cognitive trajectories associated with slower cognitive decline [38], even in individuals aged >75 years. However, the race and ethnicity of individuals comprising the populations in previous studies included in the systematic review differed from those in Korean population-based studies. Racial and ethnic differences in the study population may explain why lifestyle factors were not associated with cognitive decline in the old-old group. In addition, the KLoSA data used in this study are considered to be representative in reflecting the cultural and environmental characteristics of Korean individuals belonging to the old-old group through systematic sampling with a probability proportional to size [25].
- Contrary to previous studies, we found that the level of PA was not associated with a decreased rate of cognitive decline throughout the aging stages. A meta-analysis of prospective cohort studies [10,39] reported that PA protects against a higher rate of cognitive decline. However, the limitations of the study, including the mix of PA components (i.e., housework, gardening, cleaning the car), the limited sample populations of both sexes (male/female), and age (aged 65 years), should also be acknowledged. Few studies have focused on regular exercise, a representative measurement variable of PA, rather than on overall PA. Because the present study focused only on exercise and not on PA in a more general sense, the results regarding the influence of PA on cognitive decline might differ from those of previous studies [40].
- This study has a few limitations. First, the variable “regular exercise duration” measured the period of regular exercise until the baseline (2008). Therefore, exercise periods that ended before the survey or those that occurred after the survey were not considered in this study. Second, this variable was highly skewed toward the value of 0, which was found in 58.82% of participants in the young-old group, 65.02% in the middle-old group, and 76.95% in the old-old group, compared to the values from 1 to 5. This imbalance in the data may result in sample shortages and biased distributions. Therefore, interpreting the results in a statistically significant and generalizable manner should be done with caution. In addition, we must consider the limitations of the measurement accuracy of overall PA using a questionnaire. Further longitudinal studies including both sexes beginning in the young-old or earlier age groups can help resolve the unanswered hypothesis regarding the relationship of PA with longitudinal cognitive decline. Third, this study included time-invariant lifestyle factors measured at baseline. Future studies should consider time-varying lifestyle factors to identify dynamic longitudinal associations between changes in lifestyle factors and cognitive decline. Further studies are also required to determine the dynamic associations between specific cognitive domains and lifestyle factors in different age groups.
- Despite these limitations, this study holds significant value as it is the first to investigate the age-specific effects of lifestyle on longitudinal cognitive decline among young-old, middle-old, and old-old groups in a population-based Korean sample. Throughout the 11-year follow-up period, this study revealed distinct lifestyle factors that contributed to delaying the rate of cognitive decline in each age group. Frequent participation in SA was found to delay cognitive decline among the middle-old, while smoking was associated with the acceleration of cognitive decline in the young-old. For instance, smoking cessation among the young-old and frequent participation in SA among the middle-old were found to have potential in preventing cognitive decline. These findings highlight the importance of modifiable lifestyle factors in promoting cognitive health, and the study sheds light on the significance of age-specific approaches in cognitive health interventions.
- In conclusion, this study has provided valuable insights into the relationship between lifestyle factors and cognitive decline among different age groups. By exploring the effects of smoking and frequent SA participation on cognitive changes over an 11-year period in the young-old, middle-old, and old-old groups, this research reexamined and definitively confirmed the impact of these factors on cognitive health. The identification of age-specific influences emphasizes the necessity for tailored strategies to prevent cognitive decline in various stages of aging. Overall, this study contributes to the growing body of knowledge on cognitive health and highlights the potential benefits of targeted interventions to promote cognitive well-being across different age groups.
DISCUSSION
-
CONFLICT OF INTEREST
The authors have no conflicts of interest to declare for this study.
-
FUNDING
This work was supported by the Ministry of Education of the Republic of Korea and the National Research Foundation of Korea (NRF-2021S1A3A2A02096338).
-
AUTHOR CONTRIBUTIONS
Conceptualization: Lim S. Data curation: Lim S. Formal analysis: Lim S, Hong I, Yoo E, Park JH. Funding acquisition: Park JH. Methodology: Lim S, Park JH. Project administration: Park JH. Writing – original draft: Lim S, Hong I, Yoo E, Park JH. Writing – review & editing: Lim S.
NOTES
ACKNOWLEDGEMENTS
| Characteristics | Young-old | Middle-old | Old-old | p-value1 | |
|---|---|---|---|---|---|
| Age | 59.43±2.82 | 69.33±2.81 | 80.29±4.50 | <0.001 | |
| Sex | <0.001 | ||||
| Male | 1,089 (46.4) | 1,063 (44.2) | 540 (37.6) | ||
| Female | 1,257 (53.6) | 1,344 (55.8) | 896 (62.4) | ||
| Level of education | <0.001 | ||||
| Below elementary | 906 (38.6) | 1,572 (65.3) | 1,171 (81.5) | ||
| Middle school | 537 (22.9) | 319 (13.2) | 97 (6.7) | ||
| High school | 678 (28.9) | 360 (16.0) | 112 (7.8) | ||
| Above college | 224 (9.5) | 155 (6.4) | 56 (3.9) | ||
| Marital status | <0.001 | ||||
| Married | 2,041 (87.0) | 1,788 (74.3) | 700 (48.7) | ||
| Other | 305 (13.0) | 619 (25.7) | 736 (51.3) | ||
| Area of residence | <0.001 | ||||
| Urban | 1,811 (77.2) | 1,680 (69.8) | 974 (67.8) | ||
| Rural | 535 (22.8) | 727 (30.2) | 462 (32.2) | ||
| Log-transformed household income | 2,757.83±3,344.73 | 1,596.06±2,986.93 | 1,647.48±1,836.78 | <0.001 | |
| Employment status | <0.001 | ||||
| Currently working | 1,188 (50.6) | 684 (28.4) | 125 (8.7) | ||
| Other | 1,158 (49.4) | 1,723 (71.6) | 1,311 (91.3) | ||
| Chronic diseases | <0.001 | ||||
| None | 1,098 (46.8) | 732 (30.4) | 371 (25.8) | ||
| 1 disease | 758 (32.3) | 811 (33.7) | 500 (34.8) | ||
| ≥2 diseases | 490 (20.9) | 864 (35.9) | 565 (39.3) | ||
| Self-rated health | 3.18±0.87 | 2.78±0.88 | 2.51±0.86 | <0.001 | |
| Depressive symptoms | 3.28±2.83 | 4.22±2.98 | 5.15±3.98 | <0.001 | |
| Characteristics | Young-old | Middle-old | Old-old | p-value1 | |
|---|---|---|---|---|---|
| Regular exercise status | <0.001 | ||||
| Yes | 966 (41.2) | 842 (35.0) | 331 (23.0) | ||
| No | 1,380 (58.8) | 1,565 (65.0) | 1,105 (76.9) | ||
| Regular exercise duration (yr) | <0.001 | ||||
| None | 1,380 (58.8) | 1,565 (65.0) | 1,105 (76.9) | ||
| < 1 | 115 (4.9) | 3.49 (3.5) | 33 (2.3) | ||
| 1-2 | 226 (9.6) | 173 (7.2) | 73 (5.1) | ||
| 3-4 | 216 (9.2) | 197 (8.2) | 71 (4.9) | ||
| 5-6 | 119 (5.1) | 100 (4.1) | 37 (2.6) | ||
| ≥7 | 290 (12.4) | 288 (12.0) | 117 (8.1) | ||
| Variety of SA participation (activity) | <0.001 | ||||
| 0 | 379 (16.2) | 672 (27.9) | 614 (42.8) | ||
| 1 | 1,302 (55.5) | 1,286 (53.4) | 671 (46.7) | ||
| ≥2 | 665 (28.3) | 449 (18.6) | 151 (10.5) | ||
| Frequency of participation in SA | 7.53±5.20 | 6.42±5.34 | 5.22±5.39 | <0.001 | |
| Smoking status | <0.001 | ||||
| Current smoker | 779 (33.2) | 707 (29.4) | 375 (26.1) | ||
| Other | 1,567 (66.8) | 1,700 (70.6) | 1,061 (73.9) | ||
| Alcohol consumption | <0.001 | ||||
| Current drinker | 1,170 (49.9) | 1,007 (41.8) | 496 (34.5) | ||
| Other | 1,176 (50.1) | 1,400 (58.2) | 940 (65.5) | ||
Values are presented as β regression coefficient (95% confidence interval).
SA, social activity.
1 The presented model is adjusted for age group, sex, education, marital status, residence, log-transformed household income, employment status, chronic diseases, self-rated health, and depressive symptoms; The crude model is shown to improve table readability.
- 1. Clouston SA, Brewster P, Kuh D, Richards M, Cooper R, Hardy R, et al. The dynamic relationship between physical function and cognition in longitudinal aging cohorts. Epidemiol Rev 2013;35:33-50.ArticlePubMedPMC
- 2. Lim SJ, Park JH. The study of the convergent factors of the lifestyle on the cognitive decline among elderly. J Korea Converg Soc 2020;11:229-236 (Korean).
- 3. Cohrdes C, Mensink GB, Hölling H. How you live is how you feel? Positive associations between different lifestyle factors, cognitive functioning, and health-related quality of life across adulthood. Qual Life Res 2018;27:3281-3292.ArticlePubMedPDF
- 4. Dause TJ, Kirby ED. Aging gracefully: social engagement joins exercise and enrichment as a key lifestyle factor in resistance to age-related cognitive decline. Neural Regen Res 2019;14:39-42.ArticlePubMedPMC
- 5. Yu J, Collinson SL, Liew TM, Ng TP, Mahendran R, Kua EH, et al. Super-cognition in aging: cognitive profiles and associated lifestyle factors. Appl Neuropsychol Adult 2020;27:497-503.ArticlePubMed
- 6. Liu T, Luo H, Tang JY, Wong GH. Does lifestyle matter? Individual lifestyle factors and their additive effects associated with cognitive function in older men and women. Aging Ment Health 2020;24:405-412.ArticlePubMed
- 7. Hamer M, Muniz Terrera G, Demakakos P. Physical activity and trajectories in cognitive function: English Longitudinal Study of Ageing. J Epidemiol Community Health 2018;72:477-483.ArticlePubMedPMC
- 8. Min JW. A longitudinal study of cognitive trajectories and its factors for Koreans aged 60 and over: a latent growth mixture model. Int J Geriatr Psychiatry 2018;33:755-762.ArticlePubMedPDF
- 9. Blondell SJ, Hammersley-Mather R, Veerman JL. Does physical activity prevent cognitive decline and dementia?: A systematic review and meta-analysis of longitudinal studies. BMC Public Health 2014;14:510.ArticlePubMedPMCPDF
- 10. Sofi F, Valecchi D, Bacci D, Abbate R, Gensini GF, Casini A, et al. Physical activity and risk of cognitive decline: a meta-analysis of prospective studies. J Intern Med 2011;269:107-117.ArticlePubMed
- 11. Bae SM. The mediating effect of physical function decline on the association between social activity and cognitive function in middle and older Korean adults: analyzing ten years of data through multivariate latent growth modeling. Front Psychol 2020;11:2008.ArticlePubMedPMC
- 12. Zhou Y, Chen Z, Shaw I, Wu X, Liao S, Qi L, et al. Association between social participation and cognitive function among middle- and old-aged Chinese: a fixed-effects analysis. J Glob Health 2020;10:020801.ArticlePubMedPMC
- 13. Aartsen MJ, Smits CH, van Tilburg T, Knipscheer KC, Deeg DJ. Activity in older adults: cause or consequence of cognitive functioning? A longitudinal study on everyday activities and cognitive performance in older adults. J Gerontol B Psychol Sci Soc Sci 2002;57:P153-P162.ArticlePubMed
- 14. Brown CL, Gibbons LE, Kennison RF, Robitaille A, Lindwall M, Mitchell MB, et al. Social activity and cognitive functioning over time: a coordinated analysis of four longitudinal studies. J Aging Res 2012;2012:287438.ArticlePubMedPMCPDF
- 15. Liao J, Muniz-Terrera G, Head J, Brunner EJ. Dynamic longitudinal associations between social support and cognitive function: a prospective investigation of the directionality of associations. J Gerontol B Psychol Sci Soc Sci 2018;73:1233-1243.ArticlePubMedPMC
- 16. Hagger-Johnson G, Bell S, Britton A, Cable N, Conner M, O’Connor DB, et al. Cigarette smoking and alcohol drinking in a representative sample of English school pupils: cross-sectional and longitudinal associations. Prev Med 2013;56:304-308.ArticlePubMed
- 17. Gross AL, Rebok GW, Ford DE, Chu AY, Gallo JJ, Liang KY, et al. Alcohol consumption and domain-specific cognitive function in older adults: longitudinal data from the Johns Hopkins Precursors Study. J Gerontol B Psychol Sci Soc Sci 2011;66:39-47.ArticlePubMedPMC
- 18. Sink KM, Espeland MA, Castro CM, Church T, Cohen R, Dodson JA, et al. Effect of a 24-month physical activity intervention vs health education on cognitive outcomes in sedentary older adults: the LIFE randomized trial. JAMA 2015;314:781-790.ArticlePubMedPMC
- 19. Ngandu T, Lehtisalo J, Solomon A, Levälahti E, Ahtiluoto S, Antikainen R, et al. A 2 year multidomain intervention of diet, exercise, cognitive training, and vascular risk monitoring versus control to prevent cognitive decline in at-risk elderly people (FINGER): a randomised controlled trial. Lancet 2015;385:2255-2263.ArticlePubMed
- 20. Barnes DE, Santos-Modesitt W, Poelke G, Kramer AF, Castro C, Middleton LE, et al. The Mental Activity and eXercise (MAX) trial: a randomized controlled trial to enhance cognitive function in older adults. JAMA Intern Med 2013;173:797-804.ArticlePubMedPMC
- 21. Lowsky DJ, Olshansky SJ, Bhattacharya J, Goldman DP. Heterogeneity in healthy aging. J Gerontol A Biol Sci Med Sci 2014;69:640-649.ArticlePubMedPMC
- 22. Zhao H, Wen W, Cheng J, Jiang J, Kochan N, Niu H, et al. An accelerated degeneration of white matter microstructure and networks in the nondemented old-old. Cereb Cortex 2023;33:4688-4698.ArticlePubMedPDF
- 23. Neugarten BL. Age groups in American society and the rise of the young-old. Ann Am Acad Pol Soc Sci 1974;415:187-198.ArticlePDF
- 24. Livingston G, Huntley J, Sommerlad A, Ames D, Ballard C, Banerjee S, et al. Dementia prevention, intervention, and care: 2020 report of the Lancet Commission. Lancet 2020;396:413-446.ArticlePubMedPMC
- 25. Korea Labor Institute. User guide for 2020 Korean Longitudinal Study of Ageing. Seoul: Korea Labor Institute; 2020. p 1-2 (Korean).
- 26. Kang Y, NADL , Hahn S. A validity study on the Korean Mini-Mental State Examination (K-MMSE) in dementia patients. J Korean Neurol Assoc 1997;15:300-308 (Korean).
- 27. Folstein MF, Folstein SE, McHugh PR. “Mini-mental state”. A practical method for grading the cognitive state of patients for the clinician. J Psychiatr Res 1975;12:189-198.PubMed
- 28. Kim JH. Regular physical exercise and its association with depression: a population-based study short title: exercise and depression. Psychiatry Res 2022;309:114406.ArticlePubMed
- 29. Choi Y, Park S, Cho KH, Chun SY, Park EC. A change in social activity affect cognitive function in middle-aged and older Koreans: analysis of a Korean Longitudinal Study on Aging (2006–2012). Int J Geriatr Psychiatry 2016;31:912-919.ArticlePubMedPDF
- 30. Lee Y, Cho CC. Examining the effects of multiple chronic conditions on cognitive decline and potential moderators among older Koreans: findings from the Korean Longitudinal Study of Ageing 2006–2016. Arch Gerontol Geriatr 2021;95:104424.ArticlePubMed
- 31. Radloff LS. The CES-D scale: a self-report depression scale for research in the general population. Appl Psychol Meas 1977;1:385-401.
- 32. Lee HJ. Social activity participation and congnitive function in middle and older adults: a longitudinal study on the reciprocal relationship. Ment Health Soc Work 2015;43:138-167 (Korean).
- 33. Hu LT, Bentler PM. Cutoff criteria for fit indexes in covariance structure analysis: conventional criteria versus new alternatives. Struct Equ Modeling 1999;6:1-55.Article
- 34. Sabia S, Elbaz A, Dugravot A, Head J, Shipley M, Hagger-Johnson G, et al. Impact of smoking on cognitive decline in early old age: the Whitehall II cohort study. Arch Gen Psychiatry 2012;69:627-635.PubMedPMC
- 35. Evans IE, Martyr A, Collins R, Brayne C, Clare L. Social isolation and cognitive function in later life: a systematic review and meta-analysis. J Alzheimers Dis 2019;70(s1):S119-S144.ArticlePubMedPMC
- 36. Lee S, Charles ST, Almeida DM. Change is good for the brain: activity diversity and cognitive functioning across adulthood. J Gerontol B Psychol Sci Soc Sci 2021;76:1036-1048.ArticlePubMedPMCPDF
- 37. Bielak AA, Mogle JA, Sliwinski MJ. Two sides of the same coin? Association of variety and frequency of activity with cognition. Psychol Aging 2019;34:457-466.ArticlePubMed
- 38. Wu Z, Phyo AZ, Al-Harbi T, Woods RL, Ryan J. Distinct cognitive trajectories in late life and associated predictors and outcomes: a systematic review. J Alzheimers Dis Rep 2020;4:459-478.ArticlePubMedPMC
- 39. Beydoun MA, Beydoun HA, Gamaldo AA, Teel A, Zonderman AB, Wang Y. Epidemiologic studies of modifiable factors associated with cognition and dementia: systematic review and meta-analysis. BMC Public Health 2014;14:643.ArticlePubMedPMCPDF
- 40. Yaffe K, Barnes D, Nevitt M, Lui LY, Covinsky K. A prospective study of physical activity and cognitive decline in elderly women: women who walk. Arch Intern Med 2001;161:1703-1708.ArticlePubMed
REFERENCES
Figure & Data
References
Citations
- Social activities in multidomain dementia prevention interventions: insights from practice and a blueprint for the future
Jeroen Bruinsma, Leonie N. C. Visser, Alara Abaci, Anna Rosenberg, Ana Diaz, Sten Hanke, Rik Crutzen, Francesca Mangialasche, Miia Kivipelto, Charlotta Thunborg
Frontiers in Psychiatry.2024;[Epub] CrossRef
 PubReader
 ePub Link
 Cite
Cite

