
Articles
- Page Path
- HOME > Epidemiol Health > Volume 43; 2021 > Article
-
Data Profile
Establishment of the Korea National Health and Nutrition Examination Survey air pollution study dataset for the researchers on the health impact of ambient air pollution -
Myung-Jae Hwang1
 , Jisun Sung1, Miryoung Yoon1, Jong-Hun Kim1, Hui-Young Yun2, Dae-Ryun Choi2, Youn-Seo Koo2, Kyungwon Oh3, Sungha Yun3, Hae-Kwan Cheong1
 -
Epidemiol Health 2021;43:e2021015.
DOI: https://doi.org/10.4178/epih.e2021015
Published online: February 8, 2021
1Department of Social and Preventive Medicine, Sungkyunkwan University School of Medicine, Suwon, Korea
2Department of Environmental and Energy Engineering, Anyang University, Anyang, Korea
3Division of Health and Nutrition Survey and Analysis, Bureau of Chronic Disease Prevention and Control, Korea Disease Control and Prevention Agency, Cheongju, Korea
- Correspondence: Hae-Kwan Cheong Department of Social and Preventive Medicine, Sungkyunkwan University School of Medicine, 2066 Seobu-ro, Jangan-gu, Suwon 16419, Korea E-mail: hkcheong@skku.edu
©2021, Korean Society of Epidemiology
This is an open-access article distributed under the terms of the Creative Commons Attribution License (http://creativecommons.org/licenses/by/4.0/), which permits unrestricted use, distribution, and reproduction in any medium, provided the original work is properly cited.
Abstract
- To provide a nationwide representative dataset for the study on health impact of air pollution, we combined the data from the Korea National Health and Nutrition Examination Survey with the daily air quality and weather data by matching the date of examination and the residential address of the participants. The database of meteorological factors and air quality as sources of exposure data were estimated using the Community Multiscale Air Quality model. The linkage dataset was merged by three ways; administrative district, si-gun-gu (city, county, and district), and geocode (in latitude and longitude coordinate units) based on the participants’ residential address, respectively. During the study period, the exposure dataset of 85,018 individuals (38,306 men and 46,712 women) whose examination dates were recorded were obtained. According to the definition of exposure period, the dataset was combined with the data on short-term, mid-term, and long-term exposure to air pollutants and the meteorological indices. Calculation of the daily merged dataset’s average air pollution linked by si-gun-gu and geocode units showed similar results. This study generated a daily average of meteorological indices and air pollution exposure dataset for all regions including rural and remote areas in Korea for 11 years. It is expected to provide a platform for the researchers studying the health impact of air pollution and climate change on the representative population and area, which may facilitate the establishment of local health care plans by understanding the residents’ health status at the local as well as national level.
- Air pollution, which annually causes over 4.2 million premature deaths worldwide, has emerged as one of the major public health hazards [1]. Since the 1960s, air pollution in Korea has been intensified due to rapid urbanization and industrialization. Studies on the health impact of ambient air pollution has been reported since the late 1990s, but most of them were conducted mainly in Seoul or metropolitan areas; thus, there is a lack of nationwide research evaluating the health impact of air pollution, especially in the rural areas. Compared with countries like the United States or China, Korea has smaller land area and higher population density, which lead to air pollution affecting the whole country. Therefore, research on the health impact of air pollution in Korea should be carried out nationwide, taking into account the demographic and socioeconomic differences among regions.
- The number of air pollution monitoring posts has recently been increased, but there is still lack of monitoring posts in areas other than the metropolitan areas and capital region [2-4]. In particular, the ultrafine particles, which emerged as a major public concern lately, have been monitored only in the capital region, greatly hindering the conduct of a nationwide research on health impact of air pollution.
- The Korea Disease Control and Prevention Agency produces health database (DB) by conducting a systematic national survey including the Korea National Health and Nutrition Examination Survey (KNHANES), and the cohort study, the Korean Genome and Epidemiology Study, on a regular basis [6]. These DBs have strengths in their nationwide coverage and providing diverse information on the regional differences over decades. It also have diverse information on health and socioeconomic status of the population, and implemented with strict quality control system, meeting the global standard as a data source for conducting an outstanding health research. When these DBs are combined with air pollution dataset, they can be applied immediately to studies on the health impact of air pollution [5]. To enable the conduct of a national-level research, which links weather/air quality DB with health DB, the spatiotemporal compatibility of those two datasets must be obtained and the spatiotemporal resolution and the range of dataset must be identical in order for them to be merged.
- For assessment of health impact of air pollution, researchers are struggling to acquire a data source to determine the actual exposure date (date of survey, date of examination, etc.), atmospheric concentration of air pollutants on the same date, and residential address of the participants on si-gun-gu (city, county, or district), which are all necessary for examining the health impact of exposure to air pollution. Individual researchers used to have a restricted access in merging each participant’s health DB since it is only provided in low resolution for the purpose of privacy protection. Institutions which has a legal authority must create an aggregate DB by converting the existing data into anonymous, low resolution dataset and directly linking the existing health DB and environmental DB. The institution can then provide the dataset to individual researchers without having access to the personal information or spatiotemporal information of the individual participants during the conduct of epidemiological research.
- This project has established environmental hazard factor DB including air pollution DB in systematic methods and created a linkage DB with KNHANES. This project aimed to provide a DB platform to researchers, expecting to nurture active research, providing a scientific ground for establishing healthcare plans at the local as well as national government level.
INTRODUCTION
- The KNHANES is a nationwide survey conducted based on Article 16 of National Health Promotion Act, which was established in 1995. It had been conducted every 3 years between 1998 and 2005, and annually after 2007. KNHANES has been producing statistical data, which showed national-level, metropolitan city-level, and provincial-level representativeness and credibility on the status of health including physical examination and laboratory testing, health-related awareness and behavior, and dietary and nutritional intake (Table 1) [6,7].
- Health interview survey and health examination survey were both conducted in mobile examination centers, and nutrition survey was conducted via household visits. Data on socioeconomic status (e.g., education and economic activity), morbidity, medical use, and other items in the nutrition survey were obtained through interview, while health behaviors such as cigarette smoking and alcohol use were examined using self-administered questionnaire. All criteria for health examination were fulfilled through direct measurement, observation, and subject analysis, etc.
- KNHANES uses the most updated dataset of population and housing census from the point of sample construction for the sampling frame and complements the basic sampling frame by adding the dataset for declared value of multi-unit houses, which provides the latest information reflecting the population features, thus improving the population coverage rate. This enables the KNHANES to obtain the representative sample from the target population, which consists of citizens aged 1 year and older, currently residing in Korea. The basic sampling frames for KNHANES are the population and housing census, but the KNHANES V dataset (2010-2012) was replaced with the data of the survey on registered population and market price of apartment housing because it was already outdated [7].
- Population coverage
- This project linked the exposure data of 85,018 participants whose examination dates have been recorded, among the total study population who participated in the survey between 2007 and 2017. Examination of the distribution of the annual number of survey participants showed that the number was lowest in 2007, data of which were from the KNHANES IV (n= 4,246), since the survey was conducted only from July to December in 2007 and the number of participants was greatest in 2009 (n= 10,078). The regional distribution in the 17 metropolitan cities and provinces showed that Gyeonggi-do (province) had the biggest participants (n= 16,181), while Sejong Metropolitan city, which was only included in the survey in 2016, had the smallest participants (n= 330) (Table 2).
- Demographic characteristics of the participants of the KNHANES 2007-2017 were as follows: There were more women, 46,712 (54.9%), compared to the mens, 38,306 (45.1%). The subgroup that participated most was age group above 50 and below 60 (n= 12,107), monthly income between 2 million Korean won and 3 million Korean won (n= 23,981), and educational level of elementary school or below (n= 32,138) (Table 3).
- Ethics statement
- This present study was approved by the Institutional Review Board (IRB) of Sungkyunkwan University (IRB No. 2019-03-014).
DATA RESOURCE
- Exposure data
- This project created a meteorologic and air quality DB utilizing a chemical transport model, the Community Multiscale Air Quality (CMAQ) model. The meteorologic dataset was created threedimensionally based on temporal unit and grid unit used as input data for emission quantity model and chemical transport model along with wind field, temperature field, and humidity field. Based on the meteorologic dataset and the characteristics of each emission source, this emission quantity model generates emission quantity depending on the chemical speciation and spatiotemporal allocation, which can be applied to the air quality model.
- The chemical transport model uses a meteorologic factor of the meteorologic dataset and numerically interprets the chemical reaction of gas and aerosol, and the advection-diffusion equation is used to spatiotemporally estimate the pollutant concentration. We entered the meteorologic reanalysis data generated via CMAQ to the Weather Research Forecast version 3.6.1 and used Sparse Matrix Operator Kernel Emissions version 2.7 for the emission quantity generation model [8].
- The calculated meteorologic data included daily average temperature, average humidity, average precipitation, average wind direction, average solar radiation, and average surface pressure, which were measured in every 3 km. As for the air quality data, particulate matter (PM10) and ultrafine particulate matter (PM2.5) were measured every 1 km2 (1 km× 1 km), while gaseous materials such as nitrogen dioxide (NO2), carbon monoxide (CO), sulfur dioxide (SO2), and ozone (O3) were measured every 9 km2 (3 km× 3 km). The data were basically generated as a geocode, and the local exposure data were calculated by reassessing the gridded data as a weighted sum according to the boundaries of the city (si), county (gun), and district (gu).
- This data complemented and verified the results of the reanalysis of PM10, PM2.5, and O3 using the satellite observed data of aerosol optical depth and applying the multiple linear regression method. Since there is a lack of measurement data on PM2.5 before 2013, we calculated the reanalysis data based on the performance results of the chemical transport model. As a result of reanalyzing the model data and verifying the correlation and validity with the measurement from the actual observation point, PM10 and PM2.5 showed R2 values of 0.81 and 0.64, respectively [8].
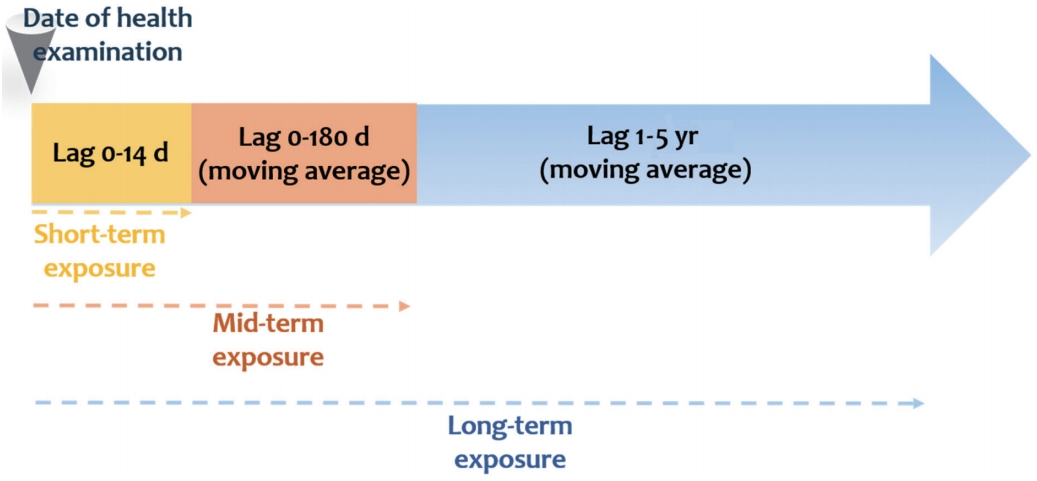
- Definition of exposure period
- In general, assessment of the effect of air pollution on the morbidity and mortality is conducted through a time-series study [9,10]. Three categories of exposure period—short-term, midterm, and long-term—are observable when evaluating the health impact of exposure to air pollution using time-series data. For the analysis, health impact and exposure period should be matched both in temporal and spatial dimension. Air pollutants absorbed into the body due to short-term exposure has an acute effect on the body’s metabolic mechanism, and continuous exposure (long-term exposure) affects the occurrence and morbidity of the disease, leading to early death.
- Therefore, this project organized the daily air pollution DB based on the exposure period so that it can be utilized for various health data provided by the KNHANES depending on the various time span of exposure and health outcome. At the moment, there is no clear-cut definition for air pollution exposure period; hence, we defined it based on the results of studies on the health impact of exposure to environmental hazard factors that have been reported on the literature (Figure 1).
- Numerous epidemiological studies are evaluating the health impact of exposure to highly concentrated air pollution within a short period of time. Previous studies only evaluated the short-term effect of air pollution due to limitations of the health data resource. Recently, studies on the health impact of long-term exposure to air pollution have been actively conducted as access to various sources has become accessible [11-13].
- This project linked the short-term data of exposure to air pollution using the examination date of the participants in the KNHANES from 2007 to 2017, which provides both exposure data and health survey data. We linked the daily average meteorological and air quality data from the date of survey, 1 day prior (lag01) to the survey, 2 days prior (lag02) to the survey, …, up to 14 days prior (lag14) to the survey, considering the lag effect of air pollution.
- The effect of exposure to air pollution is generally divided into short-term exposure and long-term exposure; recently, the number of studies on health impact from mid-term exposure to air pollution has gradually increased as data on various blood biomarkers have become available in examination surveys. For example, taking into account the fact that the life expectancy of normal red blood cells and glycated hemoglobin are approximately 120 days and 60-90 days, respectively, the mid-term exposure must be monitored in order to observe any changes in blood biomarkers due to exposure to air pollution [14].
- The mid-term exposure data were obtained by calculating the daily moving average of the meteorological data and air quality data from 30 days, 60 days, 90 days, 120 days, 150 days, and 180 days prior to the date of examination, considering the lag effect.
- In general, long-term exposure to air pollution is assessed based on the annual exposure concentration. This can be utilized not only for long-term follow-up cohort studies to evaluate the health impact of continuous exposure to air pollution, but also for cross-sectional studies such as the KNHANES or Community Health Survey, which have been conducted over years to decades [2,15].
- The long-term exposure data were determined by calculating the daily moving average of the meteorological data and air quality data from 365 days (1 year), 730 days (2 years), 1,095 days (3 years), 1,460 days (4 years), and 1,826 days (5 years) prior to the date of examination, considering the lag effect. The moving average data from 5 years prior to the date of examination was calculated because one of that timepoints had a total of 366 days instead of 365 days.
- Merging method
- In this project, the KNHANES DB was merged with the meteorological DB and air quality DB based on the survey participants’ date of examination. There are two types of linkage data based on the survey participants’ residential address: data merged by si-gun-gu (city, county, or district) units and data merged by latitude and longitude (geocode) units (Figure 2) (Supplementary Material 1). These two exposure resolution variables were connected to the examination date variable and together they created a linkage key.
- Table 4 shows the distribution of average daily exposure data merged based on the KNHANES participants’ residential address using the meteorological and air quality DB obtained from 2007 to 2017. The average air pollutant exposure level in both data merged by si-gun-gu units and data merged by geocode units were comparable. However, the average daily maximum exposure level for certain air pollutants were higher in the data merged by geocode units. The results of mid-term and long-term exposure levels are presented in Supplementary Materials 2-6.
MEASUREMENTS
Definition of short-term exposure
Definition of mid-term exposure
Definition of long-term exposure
- This project linked the KNHANES and weather/air quality DB to promote the utilization of national health data for research on the health impact of air pollution. Previous studies using national health data to analyze air pollution exposure could only produce results focused mainly on eight metropolitan areas due to the lack of measure point data. To overcome this constraint, this project produced the nationwide weather and air pollution exposure dataset and established the infrastructure to produce a nationally representative research result by enabling the linkage analysis of domestic health data resource such as KNHANES not only for the residents in cities but also for those in rural areas. Moreover, long-term data without seasonal bias could be established as the KNHANES is a survey conducted throughout the year, and thus spatiotemporal representativeness was obtained. Notably, health risks could be evaluated by determining the factors that contribute to the development of diseases caused by exposure to air pollution since information about health behavioral factors such as smoking, drinking, and physical activity on an individual level are provided. We anticipate that the local governments will be more attentive to the health impact on residents and apply the results of this analysis on the local healthcare plans. Nonetheless, there are still limitations such as the disparity between the actual observed value and the value estimated by the weather/air quality DB since they are data drawn from models, and fully overcoming the uncertainty of the non-observed points seems implausible.
- KNHANES provides diverse indices related to healthcare by conducting an annual survey and national health indices by conducting a precise examination survey. We linked these domestic representative survey data and air pollution exposure data and prepared a data profile so that epidemiological researchers can utilize the information more efficiently. If these data can be applied in various sectors through this data profile, they will serve as a theoretical ground for establishing and practicing policies related to hazardous air pollution in the local government level by allowing them to conduct comprehensive research on the health impact, reflecting the local demographic and socioeconomic features.
STRENGTHS AND WEAKNESSES
- The weather/air pollution DB linked with the KNHANES conducted from 2007 to 2017 will be provided in accordance with the provision procedure for data (http://knhanes.cdc.go.kr). Linkage data will be provided through the Data Processing Center for Academic Research after reviewing the research proposal.
DATA ACCESSIBILITY
SUPPLEMENTARY MATERIALS
Supplementary Material 1.
Supplementary Material 2.
Supplementary Material 3.
Supplementary Material 4.
Supplementary Material 5.
Supplementary Material 6.
-
CONFLICT OF INTEREST
The authors have no conflicts of interest to declare for this study
-
FUNDING
This work was supported by the Research Program funded by the Korea Centers for Disease Control and Prevention (2019-ER7106-00).
-
AUTHOR CONTRIBUTIONS
Conceptualization: MJH, JHK, HKC. Data curation: MJH, JS, MY, HYY, DRC, YSK. Formal analysis: MJH, HYY, DRC, YSK. Funding acquisition: MJH, HKC. Methodology: MJH, HKC. Project administration: HKC. Visualization: MJH, HKC. Writing – original draft: JS, MY, HYY, DRC, YSK, JHK. Writing – review & editing: HYY, DRC, YSK.
NOTES
ACKNOWLEDGEMENTS

| Regions |
Year |
Total | ||||||||||
|---|---|---|---|---|---|---|---|---|---|---|---|---|
| 2007 | 2008 | 2009 | 2010 | 2011 | 2012 | 2013 | 2014 | 2015 | 2016 | 2017 | ||
| Metropolitan city | ||||||||||||
| Seoul | 708 | 1,543 | 1,680 | 1,705 | 1,647 | 1,618 | 1,455 | 1,335 | 1,313 | 1,526 | 1,484 | 16,014 |
| Busan | 241 | 596 | 633 | 482 | 497 | 425 | 388 | 423 | 348 | 500 | 479 | 5,012 |
| Daegu | 245 | 427 | 467 | 408 | 384 | 384 | 440 | 406 | 405 | 370 | 368 | 4,304 |
| Incheon | 195 | 564 | 648 | 483 | 488 | 442 | 452 | 410 | 451 | 419 | 477 | 5,029 |
| Gwangju | 160 | 395 | 348 | 234 | 258 | 237 | 229 | 218 | 235 | 244 | 253 | 2,811 |
| Daejeon | 142 | 301 | 354 | 277 | 223 | 249 | 270 | 299 | 252 | 265 | 255 | 2,887 |
| Ulsan | 88 | 249 | 254 | 198 | 201 | 196 | 164 | 145 | 136 | 144 | 172 | 1,947 |
| Sejong2 | NA | NA | NA | NA | NA | NA | NA | NA | NA | 164 | 166 | 330 |
| Province | ||||||||||||
| Gyeonggi-do | 854 | 1,930 | 2,104 | 2,003 | 1,845 | 1,713 | 1,906 | 1,781 | 1,660 | 201 | 184 | 16,181 |
| Gangwon-do | 148 | 290 | 341 | 257 | 221 | 221 | 249 | 251 | 290 | 1,830 | 1,804 | 5,902 |
| Chungcheongbuk-do | 122 | 333 | 348 | 236 | 272 | 194 | 214 | 231 | 198 | 220 | 252 | 2,620 |
| Chungcheongnam-do | 226 | 419 | 514 | 368 | 325 | 310 | 316 | 282 | 316 | 259 | 207 | 3,542 |
| Jeollabuk-do | 135 | 406 | 351 | 328 | 316 | 309 | 245 | 222 | 257 | 315 | 239 | 3,123 |
| Jeollanam-do | 220 | 481 | 472 | 321 | 313 | 304 | 206 | 187 | 220 | 252 | 294 | 3,270 |
| Gyeongsangbuk-do | 342 | 601 | 672 | 518 | 429 | 459 | 438 | 393 | 377 | 263 | 253 | 4,745 |
| Gyeongsangnam-do | 308 | 549 | 624 | 475 | 456 | 425 | 421 | 427 | 374 | 387 | 386 | 4,832 |
| Jeju-do | 112 | 223 | 268 | 180 | 172 | 154 | 178 | 157 | 145 | 444 | 436 | 2,469 |
| Total | 4,246 | 9,307 | 10,078 | 8,473 | 8,047 | 7,640 | 7,571 | 7,167 | 6,977 | 7,803 | 7,709 | 85,018 |
NA, not applicable.
1 Evaluation of the socio-demographic characteristics showed that the women participants outnumbered the men participants by 9.8% point (women: n=46,712, 54.9% and men: n=38,306, 45.1%). The group aged 50-60 years had the highest number of participants (n=12,107), followed by those aged 40-50 years and those aged 30-40 years. Over 1,151 participants did not respond to the question related to income level. Meanwhile, 23,981 participants responded to the question related to the income level: “above 2 million Korean won and below 3 million Korean won.” A total of 3,495 participants did not respond to the question related to education level, while 32,138 responded that they only finished “elementary school.”
2 Survey was included in the survey in 2016.
- 1. World Health Organization. Ambient air pollution: a global assessment of exposure and burden of disease; 2016 [cited 2020 Dec 1]. Available from: https://www.who.int/phe/publications/air-pollution-global-assessment/en/.
- 2. Kim H, Byun G, Choi Y, Kim S, Kim SY, Lee JT. Effects of longterm exposure to air pollution on all-cause mortality and causespecific mortality in seven major cities of South Korea: Korean national health and nutritional examination surveys with mortality follow-up. Environ Res 2021;192:110290.ArticlePubMed
- 3. Han MH, Yi HJ, Kim YS, Kim YS. Effect of seasonal and monthly variation in weather and air pollution factors on stroke incidence in Seoul, Korea. Stroke 2015;46:927-935.ArticlePubMed
- 4. Son JY, Lee JT, Kim H, Yi O, Bell ML. Susceptibility to air pollution effects on mortality in Seoul, Korea: a case-crossover analysis of individual-level effect modifiers. J Expo Sci Environ Epidemiol 2012;22:227-234.ArticlePubMedPMC
- 5. Dabass A, Talbott EO, Venkat A, Rager J, Marsh GM, Sharma RK, et al. Association of exposure to particulate matter (PM2.5) air pollution and biomarkers of cardiovascular disease risk in adult NHANES participants (2001-2008). Int J Hyg Environ Health 2016;219:301-310.ArticlePubMed
- 6. Korea Disease Control Prevention and Control Agency. Korea National Health and Nutrition Examination Survey. [cited 2020 Dec 1]. Available from: https://knhanes.cdc.go.kr/knhanes/sub01/sub01_02.do (Korean).
- 7. Kweon S, Kim Y, Jang MJ, Kim Y, Kim K, Choi S, et al. Data resource profile: the Korea National Health and Nutrition Examination Survey (KNHANES). Int J Epidemiol 2014;43:69-77.ArticlePubMedPMC
- 8. Koo YS, Choi DR, Yun HY, Yoon GW, Lee JB. A development of PM concentration reanalysis method using CMAQ with surface data assimilation and MAIAC AOD in Korea. J Korean Soc Atmos Environ 2020;36:558-573 (Korean).Article
- 9. Roberts S. Interactions between particulate air pollution and temperature in air pollution mortality time series studies. Environ Res 2004;96:328-337.ArticlePubMed
- 10. Zhang C, Ding R, Xiao C, Xu Y, Cheng H, Zhu F, et al. Association between air pollution and cardiovascular mortality in Hefei, China: a time-series analysis. Environ Pollut 2017;229:790-797.ArticlePubMed
- 11. Lee JT, Kim H, Hong YC, Kwon HJ, Schwartz J, Christiani DC. Air pollution and daily mortality in seven major cities of Korea, 1991-1997. Environ Res 2000;84:247-254.ArticlePubMed
- 12. Park AK, Hong YC, Kim H. Effect of changes in season and temperature on mortality associated with air pollution in Seoul, Korea. J Epidemiol Community Health 2011;65:368-375.ArticlePubMed
- 13. Kim OJ, Kim SY, Kim H. Association between Long-term exposure to particulate matter air pollution and mortality in a South Korean National Cohort: comparison across different exposure assessment approaches. Int J Environ Res Public Health 2017;14:1103.ArticlePubMedPMC
- 14. Hwang MJ, Kim JH, Koo YS, Yun HY, Cheong HK. Impacts of ambient air pollution on glucose metabolism in Korean adults: a Korea National Health and Nutrition Examination Survey study. Environ Health 2020;19:70.ArticlePubMedPMC
- 15. Shin J, Choi J, Kim KJ. Association between long-term exposure of ambient air pollutants and cardiometabolic diseases: a 2012 Korean Community Health Survey. Nutr Metab Cardiovasc Dis 2019;29:144-151.ArticlePubMed
REFERENCES
Figure & Data
References
Citations
- Joint effect of long-term exposure to ambient air pollution on the prevalence of chronic obstructive pulmonary disease using the Korea National Health and Nutrition Examination Survey 2010–2019
Eunjin Kwon, Taiyue Jin, Young-Ah You, Byungmi Kim
Chemosphere.2024; 358: 142137. CrossRef - Associations between short-term exposure to air pollution and thyroid function in a representative sample of the Korean population
Kyoung-Nam Kim, SoHyun Park, Junseo Choi, Il-Ung Hwang
Environmental Research.2024; 252: 119018. CrossRef - Association between short- and medium-term exposure to air pollutants and depressive episode using comprehensive air quality index among the population in South Korea
Yohwan Lim, Yunseo Choi, Eunseok Kang, Yeojin Jeong, Jihyeon Park, Hyun Wook Han
Journal of Affective Disorders.2024; 356: 307. CrossRef - Association between ambient particulate matter levels and hypertension: results from the Korean Genome and Epidemiology Study
Sewhan Na, Jong-Tae Park, Seungbeom Kim, Jinwoo Han, Saemi Jung, Kyeongmin Kwak
Annals of Occupational and Environmental Medicine.2023;[Epub] CrossRef - Effect of Short- to Long-Term Exposure to Ambient Particulate Matter on Cognitive Function in a Cohort of Middle-Aged and Older Adults: KoGES
Jane J. Lee, Ji Hyun Kim, Dae Sub Song, Kyoungho Lee
International Journal of Environmental Research and Public Health.2022; 19(16): 9913. CrossRef - Long-Term Effects of Ambient Particulate and Gaseous Pollutants on Serum High-Sensitivity C-Reactive Protein Levels: A Cross-Sectional Study Using KoGES-HEXA Data
Ji Hyun Kim, Hae Dong Woo, Sunho Choi, Dae Sub Song, Jung Hyun Lee, Kyoungho Lee
International Journal of Environmental Research and Public Health.2022; 19(18): 11585. CrossRef - Effects of exposure to ambient air pollution on pulmonary function impairment in Korea: the 2007-2017 Korea National Health and Nutritional Examination Survey
Soo Beom Choi, Sungha Yun, Sun-Ja Kim, Yong Bum Park, Kyungwon Oh
Epidemiology and Health.2021; 43: e2021082. CrossRef
 PubReader
 ePub Link
 Cite
Cite


