Articles
- Page Path
- HOME > Epidemiol Health > Volume 41; 2019 > Article
-
Cohort Profile
Health Effects of Underground Workspaces cohort: study design and baseline characteristics -
Gerard Dunleavy1
 , Thirunavukkarasu Sathish1,2, Nuraini Nazeha1, Michael Soljak1, Nanthini Visvalingam1, Ram Bajpai1,3, Hui Shan Yap4, Adam C. Roberts4, Thuan Quoc Thach1, André Comiran Tonon5,6, Chee Kiong Soh4, Georgios Christopoulos7, Kei Long Cheung8, Hein de Vries9, Josip Car1
 -
Epidemiol Health 2019;41:e2019025.
DOI: https://doi.org/10.4178/epih.e2019025
Published online: August 16, 2019
1Centre for Population Health Sciences, Lee Kong Chian School of Medicine, Nanyang Technological University Singapore, Singapore, Singapore
2Population Health Research Institute, McMaster University, Hamilton, ON, Canada
3Research institute for Primary Care and Health Sciences, Keele University, Staffordshire, UK
4School of Civil and Environmental Engineering, College of Engineering, Nanyang Technological University Singapore, Singapore, Singapore
5Laboratório de Cronobiologia e Sono, Porto Alegre Clínicas Hospital (HCPA), Porto Alegre, Brazil
6Postgraduate Program in Psychiatry and Behavioral Sciences, Federal University of Rio Grande Do Sul (UFRGS), Porto Alegre, Brazil
7Division of Leadership, Management and Organisation, Nanyang Business School, College of Business, Nanyang Technological University Singapore, Singapore, Singapore
8Department of Clinical Sciences, College of Health and Life Sciences, Brunel University London, London, UK
9Department of Health Promotion, CAPHRI Care and Public Health Research Institute, Maastricht University, Maastricht, The Netherlands
- Correspondence: Gerard Dunleavy Centre for Population Health Sciences, Lee Kong Chian School of Medicine, Nanyang Technological University Singapore, 11 Mandalay Road, Singapore 308232, Singapore E-mail: gerard.dunleavyhp@gmail.com
©2019, Korean Society of Epidemiology
This is an open-access article distributed under the terms of the Creative Commons Attribution License (http://creativecommons.org/licenses/by/4.0/), which permits unrestricted use, distribution, and reproduction in any medium, provided the original work is properly cited.
Abstract
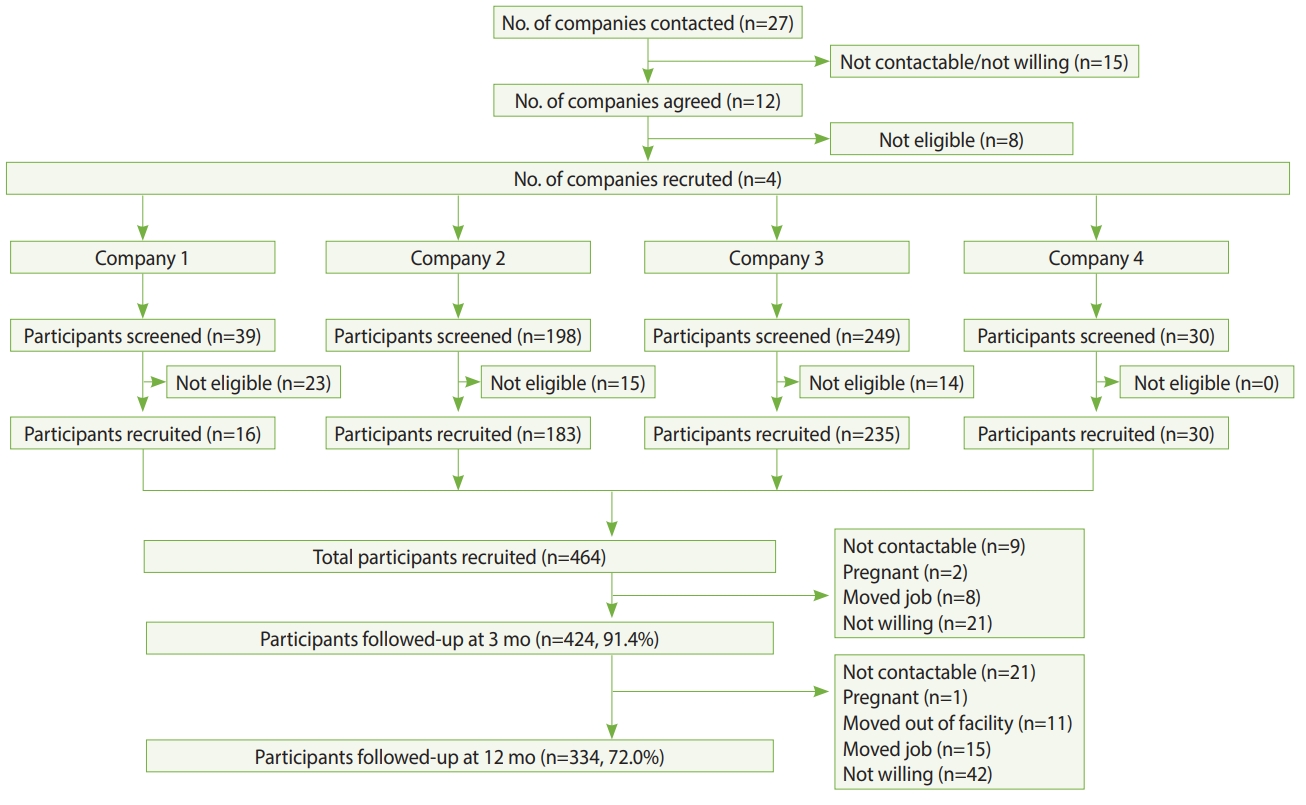
- The development of underground workspaces is a strategic effort towards healthy urban growth in cities with ever-increasing land scarcity. Despite the growth in underground workspaces, there is limited information regarding the impact of this environment on workers’ health. The Health Effects of Underground Workspaces (HEUW) study is a cohort study that was set up to examine the health effects of working in underground workspaces. In this paper, we describe the rationale for the study, study design, data collection, and baseline characteristics of participants. The HEUW study recruited 464 participants at baseline, of whom 424 (91.4%) were followed-up at 3 months and 334 (72.0%) at 12 months from baseline. We used standardized and validated questionnaires to collect information on socio-demographic and lifestyle characteristics, medical history, family history of chronic diseases, sleep quality, health-related quality of life, chronotype, psychological distress, occupational factors, and comfort levels with indoor environmental quality parameters. Clinical and anthropometric parameters including blood pressure, spirometry, height, weight, and waist and hip circumference were also measured. Biochemical tests of participants’ blood and urine samples were conducted to measure levels of glucose, lipids, and melatonin. We also conducted objective measurements of individuals’ workplace environment, assessing air quality, light intensity, temperature, thermal comfort, and bacterial and fungal counts. The findings this study will help to identify modifiable lifestyle and environmental parameters that are negatively affecting workers’ health. The findings may be used to guide the development of more health-promoting workspaces that attempt to negate any potential deleterious health effects from working in underground workspaces.
- How populations live and work is shifting, with urbanization continuing to increase now that 55% of the world’s population lives in urban areas [1]. Increasingly cities are seeing subterranean development as a strategy to meet the challenge of accommodating a greater population density [2]. Underground spaces can have a wide range of functions, including public use (e.g., shopping centres), personal use (e.g., garages), transportation (e.g., subways), utilities (e.g., water), and storage (e.g., oil), and can also serve as workspaces (e.g., offices) [3]. Although the development of underground workspaces (UWSs) may be seen as part of a solution to healthy urban growth, and as a means to reduce urban sprawl [4], questions remain as to the impact of spending extended periods of time in an UWS on an individual’s health and well-being.
- UWSs pose some risks in comparison to aboveground workspaces (AWSs), with a lack of exposure to natural sunlight being the most prominent concern [5,6]. Light is the most significant external factor in synchronizing inner circadian rhythms, which regulate the behaviour, physiology, endocrinology, and metabolism of most living systems [7]. The effect of light on sleep-wake cycles and melatonin secretion is well established [8,9], and several studies have reported that underground environments impact humans’ sleep-wake cycle [10-12]. Circadian rhythm disruption is associated with an increased risk for obesity, diabetes [13], and stroke [14]. Underexposure to natural light has also been reported to negatively impact individuals’ mental health. A number of psychological effects have been reported by those in UWSs, including anxiety [15] and depressive symptoms [16]. These psychological effects may be the result of a lack of natural light and/or a consequence of thoughts about being in an enclosed space; thoughts of confinement were highlighted as a key concern in a survey of over 1,000 participants regarding attitudes towards UWSs [17]. Additionally, indoor air quality may also be an issue in UWSs. High humidity, which is a complaint among workers in UWSs [18], is of concern as it promotes bacterial and fungal growth. A meta-analysis of 33 studies reported an association between the presence of building mould and dampness and the development of upper respiratory tract symptoms, cough, and asthma [19]. Indoor parameters such as humidity and temperature have been shown to be correlated with sick building syndrome [20], and these parameters can be difficult to maintain in UWSs [21]. To date, research on subterranean environments has mostly focused on engineering, and studies of their health effects typically involved limited professions in extreme UWS environments (e.g., miners) [16,22]. Information is limited on the health impacts from working underground in less extreme environments, such as in office-based professions, and how those impacts change over time.
- In order to better understand the health effects of UWSs, we established a workplace cohort in Singapore, called the Health Effects of Underground Workspaces (HEUW) cohort, comprising workers from UWSs and AWSs. Our primary objectives are to examine the effects of working in UWSs on sleep quality and melatonin levels. Our secondary objectives are to examine whether the UWS environment has effects on circadian rhythm, vitamin D deficiency, health-related quality of life (HRQoL), psychological distress, sick building syndrome, and lung function.
- The aim of this paper is to describe the rationale, study design, data collection, and baseline characteristics of the cohort.
INTRODUCTION
- Study design, setting, and recruitment of participants
- Recruitment of participants and baseline assessment of the HEUW cohort were conducted from August 2016 to January 2017. UWSs in Singapore were identified through online searches and discussion with civil engineers who were part of the research team. Subsequently, to obtain a suitable comparison group, AWSs with workers with a comparable job type or industry to those in UWSs were identified. A total of 27 companies in Singapore were contacted through personal visits, phone calls, and emails, of which 15 were either uncontactable or unwilling and 8 were small with fewer than 20 employees. In total, 4 companies were recruited including those from the transport industry (n=2), a cooling plant (n=1), and a university (n=1). Recruitment of participants across the 10 sites from these 4 companies was conducted in 2 steps. First, the study team approached the worksites and met with the senior management team to discuss the study. Once confirmation of participation from the management team was obtained, employees were invited to participate via worksite posters, meetings, and emails. Employees expressed their interest through their management team or directly registered with the study team at the recruitment session. Those willing to participate were screened for eligibility. Participants were eligible for selection if they were aged 21 years and above, and worked for at least 4 hr/d at their assigned workspace. Participants were deemed ineligible for selection if they were pregnant or if on average, they made at least 1 trip/mo to countries in a different time zone from Singapore in the past 6 months. Figure 1 shows the selection of study sites and participants and their follow-up at 3 months and 12 months.
- Sample size calculation
- We conducted a precision-based sample size calculation for both primary outcomes (sleep quality and melatonin levels). For sleep quality, data (unpublished) from the National Population Health Survey in Singapore [23], an ongoing survey on a representative sample (18-79 years) of Singapore citizens and permanent residents, showed that the average mean Pittsburgh Sleep Quality Index (PSQI) score was 4.12, with a standard deviation (SD) of 2.69. Assuming the true difference in mean PSQI would lie within ±1 unit of the estimated difference with a 95% confidence interval (CI), we needed a minimum of 60 participants from UWSs and 60 from AWSs. At the time of recruitment, there were no published data on melatonin available for the Singaporean population. Therefore, we used data of normative melatonin secretion values from a Japanese study [24], in which the mean± SD was 121.94±123.85 ng/mL. Assuming that the true difference in mean melatonin secretion would lie within ±10 ng/mL and with reported variance of 50% and a 95% CI, we needed a minimum of 128 participants from UWSs and 128 from AWSs. To have a better representation of participants from AWSs, we doubled that sample size to 256. We further adjusted this sample size for a 20% attrition rate at 1-year; hence, the operational sample size for this study was 461 participants. A 1-year follow-up was deemed sufficient, as participants employed in UWSs were already working for a median (interquartile range [IQR]) of 4.2 (2.5 to 8.0) years and those employed in AWSs were working for a median (IQR) of 3.3 (2.2 to 6.5) years at the time of recruitment. Furthermore, a recent systematic review of 15 studies showed that reduced melatonin levels due to exposure to artificial light recovered within 15 minutes after cessation of exposure, indicating that artificial light exposure has short-term effects on melatonin secretion [25].
- Ethics statement
- The study was approved by the Institutional Review Board (IRB) of Nanyang Technological University Singapore (IRB-2015-11-028). Study participants provided written informed consent prior to the commencement of data collection.
- Measurements
- Table 1 shows the measurement domains, tools, and follow-up time points.
- Questionnaires
- Standardized and validated questionnaires were used to collect data on socio-demographic characteristics, health behaviours, work-related characteristics, psychological characteristics, chronotype, HRQoL, medical history, sick building syndrome, and indoor environment quality (IEQ) measures.
- Data on age, gender (men, women), marital status (never married, divorced, widowed and married), education (primary and secondary, pre-college, and college degree and above), occupation, nationality (Singaporean or foreigner), ethnicity (Chinese, Malay, Indian, or others), housing type (Housing & Development Board flat, condominium, terrace, semi-detached, or bungalow) and monthly income (<S$2,000, S$2,000-S$3,999, S$4,000-S$5,999, S$6,000-S$9,999, ≥S$10,000) were collected.
- Data on smoking habits and alcohol drinking were collected using standardized questions from the World Health Organization (WHO) STEPS questionnaire [26]. Smoking questions collected information on lifetime smoking, current smoking, frequency of smoking, and amount of cigarettes smoked. Alcohol questions pertained to frequency of alcohol drinking and the average amount of alcohol consumed on a drinking day. Physical activity (PA) was assessed using the Global Physical Activity Questionnaire [27]. The duration (minutes) of an activity performed during work, travel, and leisure time on a typical day was multiplied by its metabolic-equivalent task (MET) value, and they were summed to obtain the total MET-min/wk. A MET value of 4 was assigned for moderate activities and a MET value of 8 was given for vigorous activities. The total MET-min/wk was used to categorize participants according to their PA levels; low (<600 MET-min/wk), moderate (600-2,999 MET-min/wk), and high (≥3,000 MET-min/wk) [34]. Sedentary behaviour was assessed by the following question: “How much time do you usually spend sitting or reclining on a typical day?” Dietary habits were assessed by a Food Frequency Questionnaire (FFQ), adapted from the FFQ used in the National Population Health Survey in Singapore [23]. The FFQ included questions about the usual intake of a range of food items and drinks over the last 12 months. Data on portion size and frequency of intake of these food items or drinks were collected. Eating behaviour was assessed by asking participants’ dinnertime on weekdays and weekends, and whether they snacked between dinner and bedtime. Sleep quality was measured using the PSQI [28]. This questionnaire has 19 self-rated items grouped into seven components: subjective sleep quality, sleep latency, sleep duration, habitual sleep efficiency, sleep disturbances, use of sleeping medication, and daytime dysfunction. Poor sleep quality was defined as a PSQI score >5 [28].
- Questions were included in the self-administered questionnaires to ascertain the number of years employed at the current company, work location (UWS or AWS), presence of a window viewable from the participants’ work desk, job type (control room, office, or workshop), daily working hours, shift work (day, afternoon, evening, and night shifts) on a fixed or rotational basis, average number of night shifts in a month, and average hours spent at the work desk in a day.
- The Morningness-Eveningness Questionnaire (MEQ) was used to assess participants’ chronotype [31]. The questionnaire contains 19 items related to the respondent’s preferred times for waking up and going to bed and daily activity schedules. MEQ scores range from 16 to 86; scores <42 indicate “evening types,” scores >58 indicate “morning types,” and scores between 42 and 58 indicate “intermediate types.”
- The General Health Questionnaire-12 (GHQ-12) was used to measure participants psychological distress [30]. The questionnaire contains 12 items, with 4 possible options for each item. The questionnaire includes questions on concentration, sleep, mood, emotions, self-worth, and worries during the previous 4 weeks. Responses range over a 4-point scale, from “less than usual” to “much more than usual”, and the original GHQ scoring method (0-0-1-1) was applied [35]. We applied a cut-off score of >1 to categorize participants with psychological distress [36]. Stress at home, stress at work, and financial stress were each assessed with single-item questions [37]. To assess stress at home and at work, participants were asked: “How often have you felt stress: (1) at work in the past 12 months?; (2) at home in the past 12 months?” Participants could select from: (1) never experience stress; (2) some period of stress; (3) several periods of stress; (4) permanent stress. Financial stress was assessed with the following question: “What level of financial stress do you feel?” Participants could select from: (1) none; (2) little; (3) moderate; (4) high/severe.
- The Short Form-36v2 (SF-36v2) questionnaire was used to assess HRQoL [29]. The SF-36v2 is a well-validated and widely used generic instrument to measure HRQoL. The SF-36v2 is divided into 8 scales (physical functioning, role limitation-physical, role limitation-emotional, bodily pain, general health, mental health, social functioning, and vitality) and 2 domains (physical component summary and mental component summary). Scores for each scale and domain range from 0 to 100, with higher scores indicating a better quality of life.
- Self-reported comorbidities were assessed using questions on the history of various chronic medical conditions including diabetes, heart disease, stroke, high cholesterol, hypertension, chronic kidney disease, peripheral vascular disease, asthma, allergy, and mental disorders. Participants also reported whether a family member (father, mother, or siblings) had been diagnosed with specific diseases (heart disease, hypertension, diabetes, chronic kidney disease, and dyslipidaemia), and their age of diagnosis of the disease. We also collected information on the regular use of medications and supplements.
- Sick building syndrome was assessed by a questionnaire that has been used in a nationwide morbidity survey in Singapore [32]. The questionnaire covers 11 symptoms; nose-related (stuffy, runny or sneezing), dry throat, cough, skin rash/itch, eye irritation, headache, fatigue, drowsiness/sleepiness, dizziness, nausea/vomiting, and breathing difficulties. Sick building syndrome was defined as the onset of 2 or more symptoms at least twice weekly while in the building, overnight resolution of these symptoms after leaving the building or workstation, and absence of known medical causes.
- The OFFICAIR questionnaire was used to assess the perceived comfort levels of indoor environmental conditions (temperature, noise, light, and air) [33]. For each of these parameters, participants were asked: “How would you describe the typical indoor conditions in your office environment during the past month?” These questions were answered on a 7-point scale, ranging from 1 (dissatisfied) to 7 (satisfied).
- Objective measurements
- Height, weight, and waist and hip circumference were measured by trained staff in accordance with standard protocols and tools [26]. Height was measured using a stadiometer (Seca 217, Seca GmbH, Hamburg, Germany) to the nearest 0.1 cm, and weight was measured in light clothing using a digital scale (Seca 874, Seca GmbH) to the nearest 0.1 kg. Overweight (body mass index [BMI], 23.0-27.4 kg/m2) and obesity (BMI ≥27.5 kg/m2) were defined as per the WHO recommendation for Asian populations [38]. Waist and hip circumferences were measured by a stretch-resistant tape (Seca 201, Seca GmbH). Waist circumference was measured at the midpoint between the lower margin of the last palpable rib and the top of the iliac crest (hip bone). Hip circumference was measured at the maximum circumference over the buttocks. Two measures of central obesity were calculated, based on the waist-to-hip ratio (WHR) or waist circumference alone. The WHR was calculated as the ratio between waist and hip circumferences and based on this, we defined central obesity as a WHR of ≥0.90 in men and ≥0.85 in women [39]. Using waist circumference, we defined central obesity as a waist circumference of >0.90 cm in men and >0.80 cm in women [40].
- Blood pressure, in accordance with the National Health and Nutrition Examination Survey (NHANES) protocol [41], was measured over the right arm using the appropriate cuff size with an automatic digital blood pressure monitor (Dinamap Pro100V2, Criticon, Norderstedt, Germany). The assessment was conducted by trained staff and 3 readings were taken with 2-minute intervals between the readings.
- Participants wore an Actiwatch (Actiwatch Spectrum Plus, Phillips Respironics, Bend, OR, USA), which contains an accelerometer capable of estimating locomotor activity (e.g., movement, rest/activity periods) and a luximeter that assesses ambient light exposure. Participants were requested to wear the Actiwatch 24 hours a day, for 8 consecutive days. Participants were instructed on how to use the device by trained staff and they were also requested to complete a sleep diary. The data were input into the ‘nparACT’ package for R and the chronobiology integrated software ‘El Temps’ (http://www.el-temps.com/principal.html). Double-plotted actograms were created to illustrate rest-activity rhythms. Cosinor analysis was performed by fitting the data to a sinusoidal curve of a 24-hour rhythm, which provided the following variables: mesor, amplitude, and acrophase. A Sokolove and Bushell periodogram was used to analyse the period of activity rhythm for each subject. Non-parametric serial analyses provided intracycle variability (a measure of rhythm fragmentation), interdaily stability (a measure of synchronization of the time series to the 24-hour light/dark cycle), and relative amplitude of data, as well as the 5 hours of lowest levels and the 10 hours of highest values for each variable.
- Participants were requested to wear a Fitbit Charge 2 (Fitbit Inc., San Francisco, CA, USA) 24 hours a day for 23 consecutive days. The device collected information on participants’ steps, distance, calories, heart rate, and sleep.
- Venous blood samples were collected from participants in a fasting state (at least 8 hours) by trained phlebotomists. A maximum of 11 mL of blood was drawn into 2 tubes – 8 mL in a plain tube and 3 mL in a fluoride tube. Blood samples were transported immediately, in cooler boxes (4°C), to an internationally accredited laboratory for analysis. Samples were processed using the hexokinase method for plasma glucose and enzymatic methods for serum lipids on a Cobas 6000 analyzer, using kits supplied by Roche Diagnostics (Basel, Switzerland). Low-density lipoprotein cholesterol was estimated using the Friedewald equation for those with triglycerides ≤4.52 mmol/L [42], while for the rest, values were estimated by the direct method. Serum 25-hydroxyvitamin D concentrations were measured using the chemiluminescence immunoassay method on a Cobas e 411 analyzer with kits supplied by Roche Diagnostics.
- We adhered to the NHANES home urine collection manual to collect an overnight urine sample [43]. Ice packs and a Styrofoam box were provided to participants to keep the urine cool overnight. The timing of the first urine void after 8 p.m. and the timing of the first-morning void were recorded. Total urine volume was measured and recorded. Urine samples were sent to the National University Hospital Tissue Repository Laboratory for processing and storage. Urine was aliquotted into twenty 1 mL tubes for storage and processing. One aliquot per sample was sent to National University Hospital Reference Laboratory to run urine cortisol and creatinine tests, and another aliquot from each sample was sent to the Adelaide Research Assay Facility, University of Adelaide for melatonin measurements. Overnight melatonin secretions were estimated by measuring the primary urinary metabolite of melatonin, 6-sulphatoxymelatonin, by double-antibody radioimmunoassay, using standards and reagents supplied by Stockgrand Ltd. (Guildford. UK).
- We followed the NHANES respiratory health spirometry procedures manual to conduct the spirometry tests in this study [44]. Forced expiratory volume in 1 second (FEV1), forced vital capacity (FVC), and the ratio of FEV1 to FVC were determined using an Easy-on PC Spirometer (ndd, Zurich, Switzerland). All spirometry examinations were performed with participants in a sitting position. Each participant was required to perform 3 acceptable manoeuvres. As per the NHANES guidelines, the 2 highest values for FVC and FEV1 needed to demonstrate minimal variability [44].
- IEQ parameters were objectively measured at participants’ work desks or work areas for a period of 10 minutes on a random workday. For instruments (i) to (iii) (see below), individual readings were obtained for participants with individual workspaces (i.e., specific work desks, cubicles, or work stations), whereas 5-10 readings (depending on the size of the workspace) were taken for participants in shared workspaces. The average of those readings was then assigned to participants working in those workspaces. Various instruments were used to measure the different indoor environmental parameters, as follows:
(i) Spectrometer: An optic spectrometer (AvaSpec-ULS2048L StarLine Versatile Fiber-optic Spectrometer) was used to obtain readings of illuminance (lux) at participants’ eye level at their work desks/spaces.
(ii) Digital IEQ meter: A thermal comfort meter (Testo 480, Lenzkirch, Germany), was used to measure air temperature, relative humidity, and air velocity at workplaces.
(iii) Aerosol meter: Particulate air pollution was measured with an aerosol meter (DustTrak DRX Model 8533EP, TSI, Shoreview, MN, USA) for a 10-minute period for each participant.
(iv) Microbial sampling: Microbial air sampling was carried out according to the SS554: 2016 guideline for Good Indoor Air Quality in Office Premises [45]. Single-stage microbial viable impactor sampling using the Surface Air System principle was used as a tool to collect and concentrate air in order to identify the microbial quality of the air. Triplicate readings of each selected sampling point of a workspace were measured for a period of 10 minutes at 3 different time points in a day. Laboratory analysis of air samples was conducted by a laboratory accredited under the Singapore Laboratory Accreditation Scheme.
- A number of psychological parameters were assessed, including personality characteristics, decision-making, sustained attention, response inhibition, global or local precedence, perseverance, abstract reasoning, working memory, attention, and effort discounting (Supplementary Material 1). Unlike the health measures, the majority of the psychological tests were conducted as one-off measures. Computer tests were conducted using Mueller & Piper’s Psychological Experiment Building Language [46].
- Baseline characteristics
- Tables 2-6 show the baseline characteristics of participants of the cohort (n=464).
- Socio-demographic characteristics: The mean age of participants was 39.0±11.4 years, with a large proportion (40.9%) aged more than 40 years. The majority were men (79.5%), were of Chinese ethnicity (63.8%), were married (60.3%), had at least post-secondary education (89.5%), and earned <S$4,000 per month (71.3%). There was a higher percentage of men working in UWSs than in AWSs; this was the only significant demographic difference between groups (Table 2).
- Health behaviours, stress, psychological distress, HROoL, and chronotype: Nearly a quarter of participants were current smokers (24.4%) and engaged in low levels of PA (23.1%), and slightly more than half (53.4%) were alcohol drinkers. Two-thirds (66.0%) consumed fruits and vegetables below the WHO-recommended levels (i.e., <5 servings/d). A large proportion had poor sleep quality (42.5%), close to two-thirds (62.3%) had experienced stress at home in the past 12 months, three-quarters (75.4%) were currently having financial stress, and 24.4% were considered to be experiencing psychological distress. The mean HRQoL scores for the physical and mental health scales were 51.6 and 50.2, respectively. In terms of chronotype, almost one-quarter of participants were morning types (22.4%), whilst the majority were intermediate types (65.9%) and the remaining were evening types (11.6%). There were no significant differences in health behaviours, stress, psychological distress, HROoL, or chronotype between those working in either workspace (Table 3).
- Anthropometric and clinical measurements: Based on BMI, more than two-thirds (67.0%) of participants were either overweight or obese. Almost 39.2% and 34.5% of participants had central obesity based on waist circumference and the WHR, respectively. There were no significant differences in anthropometric or clinical measurements between those working in either workspace (Table 4).
- Work-related characteristics: Nearly one-third (30.6%) were working in UWSs, and the median duration of employment was 3.8 years. The majority were office workers (48.5%), followed by control room staff (30.2%) and workshop staff (21.3%). The mean working duration per day was 8.6 hours, while more than one-third (35.8%) were shift workers. More than four-fifths (82.8%) had experienced work stress in the past 12 months. Almost one-fifth (17.9%) reported experiencing sick building syndrome symptoms because of their workspace. The only work-related characteristic that differed between groups was working hours, with individuals working in UWSs working an average of 36 minutes longer per day (Table 5).
- IEQ measures: The overall satisfaction levels with light, temperature, noise, and air quality were high, with scores ranging from 4.5 for air quality to 4.9 for light. Those working underground were significantly less satisfied with the artificial lighting in their workspace. Lux levels were below the recommended level of 500 lux in AWSs and UWSs [47]; however, there was no difference in lux between AWSs and UWSs (Table 6).
MATERIALS AND METHODS
Socio-demographic characteristics
Health behaviours
Work-related characteristics
Chronotype
Psychological distress and stress
Health-related quality of life
Medical history
Sick building syndrome
Indoor environment quality parameters
Anthropometry
Blood pressure
Actigraphy and sleep diary
Fitness tracker
Blood tests
Urine tests
Lung function
Indoor environment quality measures
Psychological and social measures
- The first paper from this cohort study was recently published [48], and found that there was no difference in the prevalence of sick building syndrome between participants in under and AWSs. Additional studies from this cohort study are undergoing peer review at various journals, and will subsequently be published.
KEY FINDINGS
- Strengths of our study include a reasonably large sample size for a workplace cohort, the use of standardized and validated questionnaires, and objective measurements of a wide range of clinical, biochemical and environmental parameters. A unique strength of this research is the multi-disciplinary approach undertaken, comprising health, psychological, and social measures. We also had high levels of questionnaire data completeness with less than 1% of missing data for variables.
- Our study is not without limitations. There was an over-representation of men, as the industries comprised mainly positions generally taken up by men such as engineers, technicians, and traffic controllers. Attrition is a common issue in workplace studies. There was a 28% loss to follow-up at 1-year, mainly due to staff turnover and a lack of time owing to work commitments or work shifts. Comparable rates of attrition have been observed in other longitudinal workplace studies in Asia at follow-up periods similar to our study [49,50]. We could not measure biochemical parameters at baseline due to logistical issues with regard to vendors and equipment. Objective environmental measurements were made difficult by work disruption and nature of work; thus, only 10 minutes of recording was possible on random workdays, which may not have accurately reflected the workplace’s environmental parameters.
STRENGTHS AND WEAKNESSES
- The study data are not freely available, but the study team would welcome collaborations with other researchers and data sharing is possible upon request and ethics approval. For further information, contact Associate Professor Josip Car, Director of the Centre for Population Health Sciences, Lee Kong Chian School of Medicine, Nanyang Technological University Singapore (josip.car@ntu.edu.sg).
DATA ACCESSIBILITY
SUPPLEMENTARY MATERIALS
-
The authors have no conflicts of interest to declare for this study.
-
AUTHOR CONTRIBUTIONS
Conceptualization: JC, GC, CKS. Data curation: GD, TS, NN, NV. Formal analysis: GD. Funding acquisition: JC, GC, CKS. Methodology: GD, TS, MS, RB, JC. Project administration: GD, TS, NN, NV. Writing – original draft: GD, TS. Writing – review & editing: NN, MS, NV, ACR, RB, TTQ, ACT, CKS, GC, KLC, HdV, JC.
NOTES
ACKNOWLEDGEMENTS

| Component | Measurement tools/questions | Baseline | 3 mo | 12 mo |
|---|---|---|---|---|
| Socio-demographic, lifestyle, medical history, health and work-related measurements and tools | ||||
| Socio-demographic characteristics | Age, gender, ethnicity, occupation, nationality, marital status, monthly income, and housing | √ | √ | √ |
| Alcohol consumption and smoking | WHO STEPS questionnaire [26] | √ | √ | √ |
| Diet | FFQ adapted from the FFQ used in the National Population Health Survey, Singa- pore [23] | √ | √ | √ |
| Physical activity and sedentary behaviour | Global Physical Activity Questionnaire [27] | √ | √ | √ |
| Steps, distance, calories, heart rate, and sleep duration with Fitbit Charge 2 (Fitbit Inc., San Francisco, CA, USA) | × | × | √ | |
| Sleep quality | Pittsburgh Sleep Quality Index [28] | √ | √ | √ |
| Comorbidities | History of high cholesterol, diabetes, stroke, coronary heart disease, mental health disorders, hypertension, peripheral vascular disease, asthma, and allergy | √ | √ | √ |
| Medication use | Regular use of medications and supplements | √ | √ | √ |
| Family history | Family history of high cholesterol, diabetes, coronary heart disease, chronic kidney disease, and hypertension | √ | √ | √ |
| Work-related characteristics | Work location (aboveground or underground workspace), presence of a window, no. of work hr/d, shift work, duration of employment in the current company, and job type (office, control room, or workshop) | √ | √ | √ |
| Health-related quality of life | 36-item Short Form Health Survey [29] | √ | √ | √ |
| Stress | Likert scale (4-point) on experiences of stress at work, at home, and financial stress [35] | √ | √ | √ |
| Psychological distress | General Health Questionnaire-12 [30] | √ | √ | √ |
| Circadian rhythm (light exposure and locomotor activity) | Mesor, amplitude, acrophase, intracycle variability, interdaily stability, and relative amplitude (Actiwatch Spectrum Plus, Phillips Respironics, Bend, OR, USA) | × | × | √ |
| Chronotype | Morningness–Eveningness Questionnaire [31] | √ | √ | √ |
| Sick building syndrome | 11-item questionnaire [32] | √ | √ | √ |
| Anthropometric and clinical measurements and tools | ||||
| Weight | Seca digital scale (Seca 874, Seca GmbH, Hamburg, Germany) | √ | √ | √ |
| Height | Seca stadiometer (Seca 217, Seca GmbH, Hamburg, Germany) | √ | × | × |
| Waist and hip circumference | Seca measuring tape (Seca 201, Seca GmbH, Hamburg, Germany) | √ | √ | √ |
| BP | Digital BP monitor (Dinamap Pro100V2 Criticon, Norderstedt, Germany) | × | × | √ |
| Blood tests (pathology) | Fasting plasma glucose, lipids, and 25-hydroxyvitamin D | × | × | √ |
| Urine tests (pathology) | Melatonin (6-sulphatoxymelatonin) | × | × | √ |
| Spirometry | Forced expiratory volume in 1 second and forced vital capacity with Easy-on PC Spirometer (ndd, Zurich, Switzerland) | √ | × | √ |
| Indoor environmental quality measurements and tools | ||||
| Light exposure | Lux (AvaSpec-ULS2048L StarLine Versatile Fiber-optic Spectrometer, The Netherlands) | × | × | √ |
| Dominant wavelength (AvaSpec-ULS2048L StarLine Versatile Fiber-optic Spectrometer, The Netherlands) | ||||
| Lux (Actiwatch Spectrum Plus, Phillips Respironics, Bend, OR, USA) | × | × | √ | |
| Self-perceived environmental quality | European project OFFICAIR questionnaire covering thermal comfort, variation in temperature, air movement, noise, light, and vibration [33] | √ | √ | √ |
| PM | PM1, PM2.5, PM4, and PM10 (DustTrak DRX Model 8533EP, TSI, Shoreview, MN, USA) | × | × | √ |
| Thermal comfort | Predicted percentage dissatisfied, predicted mean vote, temperature, humidity, and carbon dioxide with a thermal comfort meter (Testo 480, Lenzkirch, Germany) | × | × | √ |
| Bacterial and fungal counts | Single-stage microbial viable impactor sampling using Surface Air System | × | × | √ |
| Characteristics | Total (n=464) | Aboveground (n=322) | Underground (n=142) | p-value1 |
|---|---|---|---|---|
| Age (yr) | ||||
| Mean±SD | 39.0±11.4 | 38.8±11.4 | 39.6±11.4 | 0.494 |
| 21-30 | 153 (33.0) | 109 (33.8) | 44 (31.0) | 0.800 |
| 31-40 | 121 (26.1) | 84 (26.1) | 37 (26.0) | |
| >40 | 190 (40.9) | 129 (40.1) | 61 (43.0) | |
| Gender | 0.044 | |||
| Men | 369 (79.5) | 248 (77.0) | 121 (85.2) | |
| Women | 95 (20.5) | 74 (23.0) | 21 (14.8) | |
| Ethnicity | 0.493 | |||
| Chinese | 296 (63.8) | 204 (63.4) | 92 (64.8) | |
| Malays | 99 (21.3) | 73 (22.7) | 26 (18.3) | |
| Indians | 48 (10.3) | 33 (10.2) | 15 (10.6) | |
| Others2 | 21 (4.5) | 12 (3.7) | 9 (6.3) | |
| Marital status | 0.495 | |||
| Single3 | 184 (39.7) | 131 (40.7) | 53 (37.3) | |
| Married | 280 (60.3) | 191 (59.3) | 89 (62.7) | |
| Education | 0.536 | |||
| Primary and secondary | 49 (10.6) | 33 (10.2) | 16 (11.3) | |
| Pre-college | 250 (53.9) | 179 (55.6) | 71 (50.0) | |
| College and above | 165 (35.6) | 110 (34.2) | 55 (38.7) | |
| Monthly income (S$) | 0.773 | |||
| <4,000 | 331 (71.3) | 231 (71.7) | 100 (70.4) | |
| ≥4,000 | 133 (28.7) | 91 (28.3) | 42 (29.6) |
Values are presented as number (%).
SD, standard deviation.
1 Student t-test for normally distributed continuous variables and the Pearson chi-square test for categorical variables.
2 Includes mixed ethnicities, Indonesians, Pakistanis, and Filipinos.
3 Includes never-married, widowed, divorced, and separated.
| Characteristics | Total (n=464) | Aboveground (n=322) | Underground (n=142) | p-value1 |
|---|---|---|---|---|
| Smoking status | 0.829 | |||
| Never smoked | 303 (65.3) | 208 (64.6) | 95 (66.9) | |
| Ex-smoker | 48 (10.3) | 35 (10.9) | 13 (9.2) | |
| Current smoker | 113 (24.4) | 79 (24.5) | 34 (23.9) | |
| No. of cigarettes smoked/d (among current smokers) | 6.0 [1.4-10.0] | 4.3 [0.5-10.0] | 7.1 [1.4-10.0] | 0.192 |
| Alcohol drinking | 0.382 | |||
| Non-drinker | 216 (46.6) | 153 (47.5) | 63 (44.4) | |
| Drinks less than once a month | 161 (34.7) | 114 (35.4) | 47 (33.1) | |
| Drinks once or more than once a month | 87 (18.7) | 55 (17.1) | 32 (22.5) | |
| No. of standard drinks of alcohol/drinking day (among alcohol drinkers) | 2 [1-3] | 2 [1-3] | 2 [1-3] | 0.910 |
| Physical activity | 0.525 | |||
| Low | 107 (23.1) | 79 (24.5) | 28 (19.7) | |
| Moderate | 200 (43.1) | 136 (29.3) | 64 (45.1) | |
| High | 157 (33.8) | 107 (33.2) | 50 (35.2) | |
| Sedentary time (hr/d) | 6.7±3.7 | 6.6±3.7 | 6.9±3.6 | 0.466 |
| Fruit and vegetables servings/d | 3.6 [2.2-5.6] | 3.6 [2.2-5.8] | 3.6 [2.2-5.6] | 0.506 |
| PSQI global score | 5.5±2.8 | 5.4±2.8 | 5.6±2.7 | 0.574 |
| Poor sleep quality (PSQI score >5) | 197 (42.5) | 136 (42.2) | 61 (43.0) | 0.787 |
| Stress at home in the previous 12 mo | 0.272 | |||
| Never experienced stress | 175 (37.7) | 129 (40.1) | 46 (32.4) | |
| Some periods of stress | 253 (54.5) | 168 (52.2) | 85 (59.9) | |
| Several periods of stress/permanent stress | 36 (7.8) | 25 (7.8) | 11 (7.7) | |
| Current level of financial stress | 0.486 | |||
| None | 114 (24.6) | 76 (23.6) | 38 (26.8) | |
| Little | 222 (47.8) | 160 (49.7) | 62 (43.7) | |
| Moderate or severe | 128 (27.6) | 86 (26.7) | 42 (29.6) | |
| GHQ-12 score | 0 [0-1] | 0 [0-1] | 0 [0-2] | 0.434 |
| Psychological distress (GHQ-12 score >1) | 113 (24.4) | 76 (23.6) | 37 (26.1) | 0.570 |
| Physical component summary score of HRQoL scale | 51.6±6.7 | 51.6±6.7 | 51.6±6.7 | 0.977 |
| Mental component summary score of HRQoL scale | 50.2±7.7 | 50.5±7.7 | 49.5±7.8 | 0.225 |
| Chronotype | 0.492 | |||
| Morning | 104 (22.4) | 77 (23.9) | 27 (19.0) | |
| Intermediate | 306 (65.9) | 209 (64.9) | 97 (68.3) | |
| Evening | 54 (11.6) | 36 (11.2) | 18 (12.7) |
Values are presented as mean ± standard deviation (normally distributed) or median [interquartile range] (skewed) for continuous variables, and number (%) for categorical variables.
PSQI, Pittsburgh Sleep Quality Index; GHQ, General Health Questionnaire; HRQoL, health-related quality of life.
1 Student t-test for normally distributed continuous variables, the Wilcoxon rank-sum test for non-normally distributed continuous variables, and the Pearson chi-square test for categorical variables.
| Characteristics | Total (n=464) | Aboveground (n=322) | Underground (n=142) | p-value1 |
|---|---|---|---|---|
| Weight (kg) | 72.8±17.2 | 73±17.5 | 72.5±16.3 | 0.771 |
| Body mass index (kg/m2) | 25.6±5.2 | 25.8±5.4 | 23.3±4.9 | 0.414 |
| Body mass index categories (kg/m2) | 0.666 | |||
| Underweight or normal (<23.0) | 153 (33.0) | 101 (31.4) | 52 (36.6) | |
| Overweight (23.0-27.4) | 191 (41.1) | 138 (42.9) | 53 (37.3) | |
| Obesity (≥27.5) | 120 (25.9) | 83 (25.8) | 37 (26.1) | |
| Waist circumference (cm) | 85.9±13.3 | 85.8±13.5 | 86.2±13.1 | 0.737 |
| Hip circumference (cm) | 99.1±9.6 | 99.0±10.1 | 99.2±8.7 | 0.839 |
| Waist-to-hip ratio | 0.86±0.07 | 0.86±0.07 | 0.87±0.07 | 0.723 |
| Central obesity (based on waist circumference) | 182 (39.2) | 125 (38.8) | 57 (40.1) | 0.788 |
| Central obesity (based on waist-to-hip ratio) | 160 (34.5) | 113 (35.1) | 47 (33.1) | 0.677 |
| Characteristics | Total (n=464) | Aboveground (n=322) | Underground (n=142) | p-value1 |
|---|---|---|---|---|
| Years based at work location | 3.8 [2.3-6.8] | 3.3 [2.2-6.5] | 4.2 [2.5-8.0] | 0.068 |
| Job type | 0.881 | |||
| Control room worker | 140 (30.2) | 99 (30.7) | 41 (28.9) | |
| Office worker | 225 (48.5) | 156 (48.4) | 69 (48.6) | |
| Workshop worker | 99 (21.3) | 67 (20.8) | 32 (22.5) | |
| Work (hr/d) | 8.6±1.3 | 8.4±1.0 | 9.0±1.7 | <0.001 |
| Shift work | 0.193 | |||
| No | 298 (64.2) | 213 (66.1) | 85 (59.9) | |
| Yes | 166 (35.8) | 109 (33.8) | 57 (40.1) | |
| Night shift | 0.748 | |||
| No | 325 (70.0) | 227 (70.5) | 98 (69.0) | |
| Yes | 139 (30.0) | 95 (29.5) | 44 (31.0) | |
| Average night shifts/month (among night shift workers) | 8.2±3.7 | 7.8±3.7 | 9.1±3.7 | 0.050 |
| Work stress in the previous 12 mo | 0.500 | |||
| Never experienced stress | 80 (17.2) | 57 (17.7) | 23 (16.2) | |
| Some periods of stress | 279 (60.1) | 197 (61.2) | 82 (57.8) | |
| Several periods of stress or permanent stress | 105 (22.6) | 68 (21.1) | 37 (26.0) | |
| Sick building syndrome | 83 (17.9) | 60 (18.6) | 23 (16.2) | 0.528 |
Values are presented as mean±standard deviation (normally distributed) or median [interquartile range] (skewed) for continuous variables, and number (%) for categorical variables.
1 Student t-test for normally distributed continuous variables, the Wilcoxon rank-sum test for non-normally distributed continuous variables, and the Pearson chi-square test for categorical variables.
| Characteristics | Total (n=464) | Aboveground (n=322) | Underground (n=142) | p-value1 |
|---|---|---|---|---|
| Objective environmental measures | ||||
| Illuminance (lux)2 | 123.7±75.4 | 126.5±82.2 | 116.9±54.6 | 0.233 |
| Subjective indoor environment measures | ||||
| Overall comfort | 4.9±1.2 | 4.9±1.1 | 4.8±1.2 | 0.559 |
| Light overall | 4.9±1.2 | 4.9±1.2 | 4.8±1.2 | 0.239 |
| Thermal comfort | 4.7±1.3 | 4.6±1.4 | 4.8±1.3 | 0.094 |
| Noise overall | 4.8±1.4 | 4.8±1.3 | 4.9±1.4 | 0.352 |
| Air quality overall | 4.5±1.3 | 4.5±1.3 | 4.4±1.3 | 0.751 |
| Detailed subjective indoor environment measures | ||||
| Light | ||||
| Artificial light | 5.0±1.2 | 3.7±1.9 | 3.1±1.8 | 0.002 |
| Natural light | 3.5±1.9 | 5.0±1.2 | 5.0±1.2 | 0.903 |
| Reflection or glare to no reflection or glare | 4.8±1.3 | 4.7±1.3 | 4.9±1.3 | 0.136 |
| Temperature | ||||
| Temperature varies | 5.7±1.7 | 5.8±1.7 | 5.6±1.8 | 0.159 |
| Too cold or too hot | 5.4±1.7 | 5.4±1.7 | 5.4±1.6 | 0.813 |
| Air quality | ||||
| Smelly or odourless air | 4.6±1.3 | 4.6±1.2 | 4.6±1.3 | 0.966 |
| Humid or dry air | 5.5±1.6 | 5.6±1.6 | 5.4±1.7 | 0.259 |
| Stuffy or fresh air | 3.9±1.2 | 4.0±1.2 | 3.7±1.2 | 0.051 |
| Air movement | 5.2±1.8 | 5.3±1.7 | 5.0±1.9 | 0.071 |
| Noise and vibration | ||||
| Noise from outside the building | 5.1±1.5 | 5.0±1.4 | 5.2±1.5 | 0.241 |
| Noise from building systems | 4.9±1.4 | 4.8±1.3 | 4.9±1.4 | 0.794 |
| Noise from sources other than building systems | 4.7±1.4 | 4.6±1.4 | 4.8±1.4 | 0.117 |
| Vibration | 5.1±1.4 | 5.1±1.4 | 5.1±1.4 | 0.709 |
- 1. United Nations. World urbanization propects: the 2018 revision (key facts). [cited 2019 May 1]. Available from: https://population.un.org/wup/Publications/Files/WUP2018-KeyFacts.pdf.
- 2. Godard JP. Urban underground space and benefits of going underground; 2004 [cited 2019 May 1]. Available from: http://pracownicy.uwm.edu.pl/i.dyka/student_pliki/SlideGodard.pdf.
- 3. Bobylev N. Mainstreaming sustainable development into a city’s master plan: a case of urban underground space use. Land Use Policy 2009;26:1128-1137.Article
- 4. Alkaff SA, Sim SC, Efzan ME. A review of underground building towards thermal energy efficiency and sustainable development. Renew Sustain Energy Rev 2016;60:692-713.Article
- 5. Küller R, Wetterberg L. The subterranean work environment: impact on well-being and health. Environ Int 1996;22:33-52.Article
- 6. Nang EE, Abuduxike G, Posadzki P, Divakar U, Visvalingam N, Nazeha N, et al. Review of the potential health effects of light and environmental exposures in underground workplaces. Tunnelling Undergr Space Technol 2019;84:201-209.Article
- 7. Wetterberg L. Light and biological rhythms. J Intern Med 1994;235:5-19.ArticlePubMed
- 8. Brown GM. Light, melatonin and the sleep-wake cycle. J Psychiatry Neurosci 1994;19:345-353.PubMedPMC
- 9. Takasu NN, Hashimoto S, Yamanaka Y, Tanahashi Y, Yamazaki A, Honma S, et al. Repeated exposures to daytime bright light increase nocturnal melatonin rise and maintain circadian phase in young subjects under fixed sleep schedule. Am J Physiol Regul Integr Comp Physiol 2006;291:R1799-R1807.ArticlePubMed
- 10. Halberg F, Reinberg A, Haus E, Ghata J, Siffre M. Human biological rhythms during and after several months of isolation underground in natural caves. Bull Natl Speleol Soc 1970;32:89-115.
- 11. Mills JN. Circadian rhythms during and after three months in solitude underground. J Physiol 1964;174:217-231.ArticlePubMedPMC
- 12. Mills JN, Minors DS, Waterhouse JM. The circadian rhythms of human subjects without timepieces or indication of the alternation of day and night. J Physiol 1974;240:567-594.ArticlePubMedPMC
- 13. Marcheva B, Ramsey KM, Buhr ED, Kobayashi Y, Su H, Ko CH, et al. Disruption of the clock components CLOCK and BMAL1 leads to hypoinsulinaemia and diabetes. Nature 2010;466:627-631.ArticlePubMedPMCPDF
- 14. Videnovic A, Zee PC. Consequences of circadian disruption on neurologic health. Sleep Med Clin 2015;10:469-480.ArticlePubMedPMC
- 15. Hollon SD, Kendall PC, Norsted S, Watson D. Psychological responses to earth-sheltered, multilevel and aboveground structures with and without windows. Undergr Space 1980;5:171-178.
- 16. Liu L, Wang L, Chen J. Prevalence and associated factors of depressive symptoms among Chinese underground coal miners. Biomed Res Int 2014;2014:987305.ArticlePubMedPMCPDF
- 17. Lee EH, Luo C, Sam YL, Roberts AC, Kwok KW, Car J, et al. The underground workspaces questionnaire (UWSQ): investigating public attitudes toward working in underground spaces. Build Enviro 2019;153:28-34.Article
- 18. Tan Z, Roberts AC, Christopoulos GI, Kwok KW, Car J, Li X, et al. Working in underground spaces: architectural parameters, perceptions and thermal comfort measurements. Tunn Undergr Sp Tech 2018;71:428-439.Article
- 19. Fisk WJ, Lei-Gomez Q, Mendell MJ. Meta-analyses of the associations of respiratory health effects with dampness and mold in homes. Indoor Air 2007;17:284-296.ArticlePubMed
- 20. McGill G, Oyedele LO, McAllister K. An investigation of indoor air quality, thermal comfort and sick building syndrome symptoms in UK energy efficient homes. Smart Sustain Built Environ 2015;4:329-348.Article
- 21. Ampofo F, Maidment G, Missenden J. Underground railway environment in the UK Part 1: review of thermal comfort. Appl Therm Eng 2004;24:611-631.Article
- 22. Eisler R. Health risks of gold miners: a synoptic review. Environ Geochem Health 2003;25:325-345.ArticlePubMed
- 23. Health Promotion Board Singapore. National Population Health Survey (NPHS). [cited 2019 May 1]. Available from: https://www.hpb.gov.sg/community/national-population-health-survey.
- 24. Wetterberg L, Bratlid T, von Knorring L, Eberhard G, Yuwiler A. A multinational study of the relationships between nighttime urinary melatonin production, age, gender, body size, and latitude. Eur Arch Psychiatry Clin Neurosci 1999;249:256-262.ArticlePubMedPDF
- 25. Tähkämö L, Partonen T, Pesonen AK. Systematic review of light exposure impact on human circadian rhythm. Chronobiol Int 2019;36:151-170.ArticlePubMed
- 26. World Health Organization. The WHO STEPwise approach to noncommunicable disease risk factor surveillance; 2017 [cited 2019 May 1]. Available from: https://www.who.int/ncds/surveillance/steps/STEPS_Manual.pdf?ua=1.
- 27. Bull FC, Maslin TS, Armstrong T. Global physical activity questionnaire (GPAQ): nine country reliability and validity study. J Phys Act Health 2009;6:790-804.ArticlePubMed
- 28. Buysse DJ, Reynolds CF 3rd, Monk TH, Berman SR, Kupfer DJ. The Pittsburgh Sleep Quality Index: a new instrument for psychiatric practice and research. Psychiatry Res 1989;28:193-213.ArticlePubMed
- 29. Ware JE Jr, Sherbourne CD. The MOS 36-item short-form health survey (SF-36). I. Conceptual framework and item selection. Med Care 1992;30:473-483.ArticlePubMed
- 30. Banks MH, Clegg CW, Jackson PR, Kemp NJ, Stafford EM, Wall TD. The use of the general health questionnaire as an indicator of mental health in occupational studies. J Occup Psychol 1980;53:187-194.Article
- 31. Horne JA, Ostberg O. A self-assessment questionnaire to determine morningness-eveningness in human circadian rhythms. Int J Chronobiol 1976;4:97-110.PubMed
- 32. Ooi PL, Goh KT, Phoon MH, Foo SC, Yap HM. Epidemiology of sick building syndrome and its associated risk factors in Singapore. Occup Environ Med 1998;55:188-193.ArticlePubMedPMC
- 33. Sakellaris IA, Saraga DE, Mandin C, Roda C, Fossati S, de Kluizenaar Y, et al. Perceived indoor environment and occupants’ comfort in European “modern” office buildings: The OFFICAIR study. Int J Environ Res Public Health 2016;13:E444.Article
- 34. World Health Organization. Global recommendations on physical activity for health; 2010 [cited 2019 May 1]. Available from: https://www.who.int/dietphysicalactivity/publications/9789241599979/en/.
- 35. McDowell I. Measuring health: a guide to rating scales and questionnaires, third edition; 2006 [cited 2019 May 1]. Available from: https://pdfs.semanticscholar.org/33f5/6f2796d171358061bd88c36f86e7edd0426f.pdf.
- 36. Lim L, Ng TP, Chua HC, Chiam PC, Won V, Lee T, et al. Generalised anxiety disorder in Singapore: prevalence, co-morbidity and risk factors in a multi-ethnic population. Soc Psychiatry Psychiatr Epidemiol 2005;40:972-979.ArticlePubMedPDF
- 37. Rosengren A, Hawken S, Ounpuu S, Sliwa K, Zubaid M, Almahmeed WA, et al. Association of psychosocial risk factors with risk of acute myocardial infarction in 11119 cases and 13648 controls from 52 countries (the INTERHEART study): case-control study. Lancet 2004;364:953-962.ArticlePubMed
- 38. WHO Expert Consultation. Appropriate body-mass index for Asian populations and its implications for policy and intervention strategies. Lancet 2004;363:157-163.ArticlePubMed
- 39. World Health Organization Western Pacific Region. The Asia-Pacific perspective: redefining obesity and its treatment; 2000 [cited 2019 May 14]. Available from: http://www.wpro.who.int/nutrition/documents/docs/Redefiningobesity.pdf.
- 40. International Diabetes Federation (IDF). The IDF consensus worldwide definition of the metabolic syndrome; 2006 [cited 2019 May 14]. Available from: https://www.idf.org/e-library/consensus-statements/60-idfconsensus-worldwide-definitionof-the-metabolic-syndrome.html.
- 41. Centers for Disease Control and Prevention. National Health and Nutrition Examination Survey (NHANES): physician examination procedures manual; 2015 [cited 2019 May 14]. Available from: https://wwwn.cdc.gov/nchs/data/nhanes/2015-2016/manuals/2015_Physician_Examination_Procedures_Manual.pdf.
- 42. Friedewald WT, Levy RI, Fredrickson DS. Estimation of the concentration of low-density lipoprotein cholesterol in plasma, without use of the preparative ultracentrifuge. Clin Chem 1972;18:499-502.ArticlePubMedPDF
- 43. Centers for Disease Control and Prevention. National Health and Nutrition Examination Survey (NHANES): home urine collection; 2013 [cited 2019 May 14]. Available from: https://wwwn.cdc.gov/nchs/data/nhanes/2013-2014/manuals/Home_Urine_Collection.pdf.
- 44. Centers for Disease Control and Prevention. National Health and Nutrition Examination Survey (NHANES): respiratory health spirometry procedures manual; 2011 [cited 2019 May 1]. Available from: http://www.cdc.gov/nchs/data/nhanes/nhanes_11_12/Spirometry_Procedures_Manual.pdf.
- 45. Singapore Standards Council. Singapore standard: code of practice for indoor air quality for air-conditioned buildings; 2016 [cited 2019 May 1]. Available from: https://www.singaporestandardseshop.sg/Product/SSPdtDetail/8ee48ab1-38f5-4dae-a469-b8612 a05876f.
- 46. Mueller ST, Piper BJ. The psychology experiment building language (PEBL) and PEBL test battery. J Neurosci Methods 2014;222:250-259.ArticlePubMed
- 47. Singapore Standards Council. SS 531-1: 2006 (2013). Code of practice for lighting of workplaces – indoor; 2013 [cited 2019 May 1]. Available from: https://www.singaporestandardseshop.sg/Product/SSPdtDetail/df67737c-a95c-4a21-acfb-a52b086e37b4.
- 48. Thach TQ, Mahirah D, Dunleavy G, Nazeha N, Zhang Y, Hui CT, et al. Prevalence of sick building syndrome and its association with perceived indoor environmental quality in an Asian multiethnic working population. Build Environ 2019;166:106420.Article
- 49. Inoue M, Toyokawa S, Inoue K, Suyama Y, Miyano Y, Suzuki T, et al. Lifestyle, weight perception and change in body mass index of Japanese workers: MY Health Up Study. Public Health 2010;124:530-537.ArticlePubMed
- 50. Watanabe K, Kawakami N, Otsuka Y, Inoue S. Associations among workplace environment, self-regulation, and domain-specific physical activities among white-collar workers: a multilevel longitudinal study. Int J Behav Nutr Phys Act 2018;15:47.ArticlePubMedPMCPDF
REFERENCES
Figure & Data
References
Citations
- Integrated lighting ergonomics: A review on the association between non-visual effects of light and ergonomics in the enclosed cabins
Zhiming Gou, Bingchen Gou, Wenyi Liao, Yuxue Bao, Yongqi Deng
Building and Environment.2023; 243: 110616. CrossRef - Effects of fun-seeking and external locus of control on smoking behaviour: a cross-sectional analysis on a cohort of working men in Singapore
Kar Fye Alvin Lee, Eun Hee Lee, Adam Charles Roberts, Josip Car, Chee Kiong Soh, Georgios Christopoulos
BMJ Open.2022; 12(10): e061318. CrossRef - A Comparative Study of International and Asian Criteria for Overweight or Obesity at Workplaces in Singapore
Nuraini Nazeha, Thirunavukkarasu Sathish, Michael Soljak, Gerard Dunleavy, Nanthini Visvalingam, Ushashree Divakar, Ram Chandra Bajpai, Chee Kiong Soh, George Christopoulos, Josip Car
Asia Pacific Journal of Public Health.2021; 33(4): 404. CrossRef - Prevalence of and factors associated with poor sleep quality and short sleep in a working population in Singapore
Nanthini Visvalingam, Thirunavukkarasu Sathish, Michael Soljak, Ai-Ping Chua, Gerard Dunleavy, Ushashree Divakar, Nuraini Nazeha, Ram Bajpai, Chee Kiong Soh, Kwok Kian Woon, Georgios Christopoulos, Josip Car
Sleep Health.2020; 6(3): 277. CrossRef - Activity Tracker–Based Metrics as Digital Markers of Cardiometabolic Health: Cross-Sectional Study
Yuri Rykov, Thuan-Quoc Thach, Gerard Dunleavy, Adam Charles Roberts, George Christopoulos, Chee Kiong Soh, Josip Car
JMIR mHealth and uHealth.2020; 8(1): e16409. CrossRef - Prevalence of psychological distress and its association with perceived indoor environmental quality and workplace factors in under and aboveground workplaces
Gerard Dunleavy, Ram Bajpai, André Comiran Tonon, Kei Long Cheung, Thuan-Quoc Thach, Yuri Rykov, Chee-Kiong Soh, Hein de Vries, Josip Car, Georgios Christopoulos
Building and Environment.2020; 175: 106799. CrossRef - Employee experiences in underground workplaces: a qualitative investigation
Vinita Venugopal, Adam Charles Roberts, Kian-Woon Kwok, George I. Christopoulos, Chee-Kiong Soh
Ergonomics.2020; 63(11): 1337. CrossRef - Associations of perceived indoor environmental quality with stress in the workplace
Thuan‐Quoc Thach, Dhiya Mahirah, Charlotte Sauter, Adam Charles Roberts, Gerard Dunleavy, Nuraini Nazeha, Yuri Rykov, Yichi Zhang, George I. Christopoulos, Chee‐Kiong Soh, Josip Car
Indoor Air.2020; 30(6): 1166. CrossRef - White- and Blue- collar workers responses’ towards underground workspaces
Ying Su, Adam C. Roberts, Hui Shan Yap, Josip Car, Kian Woon Kwok, Chee-Kiong Soh, George I. Christopoulos
Tunnelling and Underground Space Technology.2020; 105: 103526. CrossRef - Prevalence of sick building syndrome and its association with perceived indoor environmental quality in an Asian multi-ethnic working population
Thuan-Quoc Thach, Dhiya Mahirah, Gerard Dunleavy, Nuraini Nazeha, Yichi Zhang, Christina En Hui Tan, Adam Charles Roberts, George Christopoulos, Chee Kiong Soh, Josip Car
Building and Environment.2019; 166: 106420. CrossRef - A Multifactorial Approach to Sleep and Its Association with Health-Related Quality of Life in a Multiethnic Asian Working Population: A Cross-Sectional Analysis
Gerard Dunleavy, André Comiran Tonon, Ai Ping Chua, Yichi Zhang, Kei Long Cheung, Thuan-Quoc Thach, Yuri Rykov, Chee-Kiong Soh, Georgios Christopoulos, Hein de Vries, Josip Car
International Journal of Environmental Research and Public Health.2019; 16(21): 4147. CrossRef - Risk Factors for Non-Communicable Diseases at Baseline and Their Short-Term Changes in a Workplace Cohort in Singapore
Thirunavukkarasu Sathish, Gerard Dunleavy, Michael Soljak, Nanthini Visvalingam, Nuraini Nazeha, Ushashree Divakar, Ram Bajpai, Thuan-Quoc Thach, Kei Cheung, Hein Vries, Chee-Kiong Soh, Georgios Christopoulos, Josip Car
International Journal of Environmental Research and Public Health.2019; 16(22): 4551. CrossRef - Examining the Factor Structure of the Pittsburgh Sleep Quality Index in a Multi-Ethnic Working Population in Singapore
Gerard Dunleavy, Ram Bajpai, André Comiran Tonon, Ai Ping Chua, Kei Long Cheung, Chee-Kiong Soh, Georgios Christopoulos, Hein de Vries, Josip Car
International Journal of Environmental Research and Public Health.2019; 16(23): 4590. CrossRef - Prevalence of Vitamin D Deficiency and Its Associated Work-Related Factors among Indoor Workers in a Multi-Ethnic Southeast Asian Country
Ushashree Divakar, Thirunavukkarasu Sathish, Michael Soljak, Ram Bajpai, Gerard Dunleavy, Nanthini Visvalingam, Nuraini Nazeha, Chee Kiong Soh, Georgios Christopoulos, Josip Car
International Journal of Environmental Research and Public Health.2019; 17(1): 164. CrossRef
 PubReader
 ePub Link
 Cite
Cite