
Articles
- Page Path
- HOME > Epidemiol Health > Volume 40; 2018 > Article
-
Original Article
The coverage rates for influenza vaccination and related factors in Korean adults aged 50 and older with chronic disease: based on 2016 Community Health Survey data -
Kyeong Hyang Byeon1,2
 , Jaiyong Kim2, Boyoung Choi3, Bo Youl Choi2
 -
Epidemiol Health 2018;40:e2018034.
DOI: https://doi.org/10.4178/epih.e2018034
Published online: July 24, 2018
1Department of Public Health, Graduate School, Hanyang University, Seoul, Korea
2Department of Preventive Medicine, Hanyang University College of Medicine, Seoul, Korea
3Department of Public Health and Medical Administration, Dongyang University, Yeongju, Korea
- Correspondence: Bo Youl Choi Department of Preventive Medicine, Hanyang University College of Medicine, 222 Wangsimni-ro, Seongdong-gu, Seoul 04763, Korea E-mail: bychoi@hanyang.ac.kr
©2018, Korean Society of Epidemiology
This is an open-access article distributed under the terms of the Creative Commons Attribution License (http://creativecommons.org/licenses/by/4.0/), which permits unrestricted use, distribution, and reproduction in any medium, provided the original work is properly cited.
Abstract
-
OBJECTIVES
- This study aims to identify the coverage rates for influenza vaccination and related factors depending on chronic disease in Korean adults aged 50 and older.
-
METHODS
- The 2016 Korea Community Health Survey was used for analysis. Chi-square test was performed to investigate the coverage rates for influenza vaccination depending on chronic disease, and a multiple logistic regression analysis was used to identify the factors associated with influenza vaccination, by chronic disease.
-
RESULTS
- In men with ≥1 chronic disease, 39.8% of 50-64 years of age, and 86.8% of elderly (over 65 years of age) received influenza vaccination. In women with ≥1 chronic disease, 58.7% of 50-64 years of age, and 89.9% of elderly (over 65 years of age) received influenza vaccination (p<0.001). The chronic diseases associated with influenza vaccination were hypertension (odds ratio [OR], 1.27; 95% confidence interval [CI], 1.19 to 1.37), diabetes (OR, 1.41; 95% CI, 1.28 to 1.55) in men aged 50-64, hypertension (OR, 1.34; 95% CI, 1.20 to 1.49), diabetes (OR, 1.17; 95% CI, 1.02 to 1.33), chronic cardiovascular disease (OR, 1.31; 95% CI, 1.07 to 1.60) in elderly (over 65 years of age). In women aged 50-64, hypertension (OR, 1.39; 95% CI, 1.30 to 1.49), diabetes (OR, 1.51; 95% CI, 1.35 to 1.68), chronic cardiovascular disease (OR, 1.31; 95% CI, 1.05 to 1.64), and hypertension (OR, 1.55; 95% CI, 1.40 to 1.71), diabetes (OR, 1.27; 95% CI, 1.12 to 1.43) in elderly (over 65 years of age).
-
CONCLUSIONS
- Populations in aged 50-64 are recommendation subject for vaccination or classified as high-risk group in case with chronic disease. Though subject over 60 years old is age close to the elderly, the coverage rates for vaccination was low. It is necessary to devise strategies to raise the coverage rates for vaccination.
- Influenza is an acute respiratory disease caused by influenza virus infection. Elderly persons and patients with chronic diseases are defined as a high-risk group as they are at high adult, Korea Community Health Survey (KCHS), Korea risk of contracting influenza or complications. The high-risk group is at high-risk of complications such as pneumonia. Some patients require hospitalization and intensive care due to severe complications and die in some cases [1].
- According to the Korea’s National Health Insurance Service data (2015), there were 5,293 patients aged 65 years or older, 5,453 patients aged 50-64 years, and 6,412 patients aged 30-40, who were seasonal influenza; the number of patients hospitalized for influenza increased as age decreased [2]. The number of inpatients per 100,000 registered residents was 78.1 for those aged 65 years or older, 48.7 for those aged 50-64 years, and 38.8 for those aged 30-49 years [3]. Since influenza can be prevented by prophylactic vaccination, receiving a vaccination before an outbreak occurs is essential, and an influenza outbreak can cause public health problems in local communities [4].
- Vaccination is the most effective method to prevent influenza. The effect of vaccination varies by age and underlying disease. Vaccination is 70-90% effective in healthy adults, 50-60% effective for elderly patients who are hospitalized for influenza, and 80% in preventing death [5]. In chronic patients, vaccination can decrease the risks of influenza-like illnesses, pneumonia, hospitalization, and death [6]. In Korea, priority subjects for vaccination including those aged 65 years or older have been consistently instructed to receive vaccination even before an influenza outbreak alert is released, and those who have not been vaccinated are recommended to receive vaccination even if an outbreak has already occurred [7,8].
- In the US, the coverage rates of vaccination was 63.4% for persons aged 65 years or older and 43.6% for those aged 50-60 years. In Korea, the rate of vaccination was 81.7% for those aged 65 years or older and 28.4% for those aged 50-64 years [5,9-11]. The rate of vaccination among those aged 50-64 years in Korea can be considered quite low considering that these subjects were the priority influenza vaccination group.
- Healthy People 2020 of the US aims to raise the rate of influenza vaccination among elderly persons aged 65 years or older and patients with chronic diseases, who are classified as high-risk groups, to 90%. Korea aims to raise the vaccination rate among elderly persons aged 65 years or older to 82% but has not clarified the target vaccination rate for patients with chronic diseases who are classified as high-risk groups. Previous studies have reported low vaccination rates among patients with chronic diseases [12,13].
- This study was conducted to investigate the rate of influenza vaccination in patients with chronic diseases who were aged 50-64 years in 2016 and to identify the factors that affect the actual vaccination rate to ultimately obtain basic research materials for increasing the vaccination rate among persons aged 50-64 years.
INTRODUCTION
- Subjects and materials
- The original data of the 2016 KCHS were used. 56,917 men and 73,693 women who responded to an influenza vaccination questionnaire were included [14].
- Variable selection and definition
- In this study, the dependent variables were the variables of influenza vaccination. Persons who were vaccinated were defined as “yes”, and those who were not were defined as “no”.
- The socioeconomic factors of the independent variables included gender, age, city and province, family income, education level, occupation type and marital status. The variables of health behaviors included smoking, drinking, walking, and subjective health status. Chronic diseases included hypertension, diabetes, myocardial infarction or angina, and stroke. Since all chronic diseases except for hypertension were associated with a high-risk of severe influenza or complications, patients with these chronic diseases were defined as high-risk groups [1]. For use of medical services, health examination, and use of health centers were used.
- Statistical analysis
- The KCHS data are complex sample data. Weighted values, strata, and clusters were included in each stage of analysis and analyzed using a SURVEY procedure.
- A chi-square test was performed to investigate significant differences in the socioeconomic factors, health behavior factors, chronic disease status, use of medical services, and influenza vaccination among the subjects. A multiple logistic regression analysis was performed to investigate the factors that affect the influenza vaccination coverage rate among subjects aged 50 years or older. Regions were divided into province, metropolis, medium cities and rural areas, and the coverage rate of influenza vaccination in subjects aged 50 years or older was investigated according to whether or not the subjects had at least one chronic disease.
- Data were analyzed using SAS version 9.4 (SAS Institute Inc., Cary, NC, USA).
MATERIALS AND METHODS
- Influenza vaccination coverage rates by age among subjects aged 50 years or older
- Vaccination coverage rates by age were 23.2% for men aged 50-54 years, 31.3% for women aged 50-54 years, 76.9% for men aged 65-69 years, and 83.3% for women aged 65-69 years (Table 1). The highest vaccination coverage rates were observed among men and women aged 60-64 years among all subjects aged 50-64 years. High influenza vaccination coverage rates of 90.2% were observed for men aged 80-84 years and of 91.1% for women aged 75-79 years among all subjects aged 65 years older.
- Health-related factors and characteristics of influenza vaccination coverage rates among subjects aged 50 years or older
- Regarding vaccination coverage rates among subjects aged 50-64 years and those aged 65 years or older, the vaccination coverage rate was 30.5% for men aged 50-64 years, 43.8% for women aged 50-64 years, 84.3% for men aged 65 years or older, and 87.8% for women aged 65 years or older; women showed higher vaccination coverage rates (Table 2). In the low household income group, the vaccination coverage rate was 35.9% for men aged 50-64 years, 52.1% for women aged 50-64 years. Men aged 65 years or older had the highest vaccination coverage rate of 85.1%. There was no significant difference in the vaccination according to the household income among women aged 65 years or older. The vaccination decreased as the education level increased among men and women aged 50-64 years and women aged 65 years or older. There was no significant difference in the vaccination coverage rate according to the education level among men aged 65 years or older. Regarding vaccination coverage rates by occupation, vaccination coverage rates were higher among unemployed subjects in all age and gender groups. Regarding vaccination coverage rates by marital status, the vaccination coverage rate was 31.2% for men aged 50-64 years who had a spouse or cohabitant and was high at 85.1% for men aged 65-year or older who had a spouse or cohabitant. The vaccination coverage rate was 46.3% for women aged 50-65 years whose marital status was others (divorced, widowed, separated) and was the highest at 90.2% among single women aged 65 years or older. Higher vaccination coverage rates were observed for men who were former smokers and women who were non-smokers. The vaccination coverage rate was high at 88.3% for both men and women aged 50-64 years and women aged 65 years or older who did not drink alcohol. High vaccination coverage rates were observed among women aged 50-64 years and men and women aged 65 years older who engaged in walking activities. Higher vaccination coverage rates were observed for subjects with poorer subjective health statuses in all groups. Higher vaccination coverage rates were observed for both men and women who had health examinations and visited public health centers.
- Status of chronic disease and characteristics of influenza vaccination coverage rates among subjects aged 50 years or older
- High vaccination coverage rates were observed among men and women with hypertension, diabetes, chronic cardiovascular disease or stroke. Significant difference in the vaccination coverage rate was observed among men and women aged 50-64 years according to whether or not they had stroke (Table 3). Regarding vaccination coverage rates for those with at least one chronic disease, the vaccination coverage rate was 39.8% for men aged 50-64 years, 58.7% for women aged 50-64 years, 86.8% for men aged 65 years or older, and 89.9% for women aged 64 years or older. Higher vaccination coverage rates were observed when the subjects had chronic diseases. Regarding vaccination coverage rates by the number of chronic diseases, the vaccination coverage rate was 39.3, 43.1 and 53.8% in the presence of one, two and three chronic diseases, respectively, among men aged 50-64 years. The vaccination coverage rate was 58.2, 65.3, and 88.7% in the presence of one, two and three chronic diseases, respectively, among women aged 50-64 years. The vaccination coverage rate was 86.3, 89.0, and 89.9% in the presence of one, two and three chronic diseases, respectively, for men aged 65 years or older, and 90.0, 90.0, and 83.6% in the presence of one, two and three chronic diseases, respectively, among women aged 65 years or older. Therefore, the vaccination coverage rate increased as the number of accompanying chronic diseases increased.
- Factors affecting influenza vaccination among subjects aged 50 years or older
- Regarding the factors affecting influenza vaccination among men, the vaccination coverage rate was 19.0% lower for men aged 50-64 years in the middle household income group (95% confidence interval [CI], 0.70 to 0.92). The vaccination coverage rate was 29.0% lower for men aged 50-64 years who completed high school education than those who completed middle school education or lower (95% CI, 0.65 to 0.77) and was 43.0% lower for those who completed a university degree or above (95% CI, 0.52 to 0.63) (Table 4). Regarding vaccination coverage rates by occupations, the vaccination rate was 14.0% lower among men aged 50-64 years who did manual labor than office workers (95% CI, 0.78 to 0.94). The odds ratio (OR) for vaccination was high at 1.41 for men aged 65 years or over (95% CI, 1.13 to 1.17). The OR for vaccination was 1.23 times higher for single men aged 50-64 years relative to those who were married (95% CI, 1.02 to 1.47). For men aged 65 years or older, the OR for vaccination was 3.49 times higher (95% CI, 2.01 to 6.05) for those with a spouse and 2.57 times higher (95% CI, 1.47 to 4.50) for those with other marital statuses. Among men aged 50-64 years, the OR for vaccination was 1.48 times higher (95% CI, 1.38 to 1.60) for current smokers and 1.56 times higher (95% CI, 1.42 to 1.72) for non-smokers compared to former smokers. Among men aged 65 years or older, the OR was 1.61 times higher (95% CI, 1.43 to 1.81) for former smokers and 1.57 times higher (95% CI, 1.34 to 1.82) for non-smokers. Among men aged 50-64 years, the vaccination coverage rate was 19.0% lower for those who consumed alcohol (95% CI, 0.71 to 0.92). The OR for vaccination was 1.20 times higher (95% CI, 1.08 to 1.33) for men aged 65 years or older who engaged in walking activities. Among men aged 50-64 years, the vaccination coverage rate was 16.0% lower for those with poorer subjective health statuses (95% CI, 0.75 to 0.93). The vaccination coverage rate was 30.0% lower for men aged 65 years or older who had good subjective health statuses (95% CI, 0.61 to 0.81). The OR for vaccination was 2.29 times higher (95% CI, 2.09 to 2.51) and 2.68 times higher (95% CI, 2.39 to 3.00) for men aged 50-64 years and those aged 65 years or older who had health examinations, respectively. The OR for vaccination was 2.36 times higher (95% CI, 2.19 to 2.54) for men aged 50-64 years who visited public health centers and 4.31 times higher (95% CI, 3.85 to 4.82) for men aged 65 years or older who visited public health centers.
- For women, the vaccination coverage rate was 14.0% lower for those aged 50-64 years with middle to high household incomes (95% CI, 0.77 to 0.95). The OR for vaccination was 1.40 times higher (95% CI, 1.14 to 1.70) for those aged 65 years or older. The vaccination coverage rate was 34.0% for women aged 50-64 years who completed high school education relative to those who completed middle school education or below (95% CI, 0.62 to 0.71). The vaccination coverage rate was 47.0% lower (95% CI, 0.48 to 0.58) for women who completed a university degree or above. The vaccination coverage rate was 13.0% lower (95% CI, 0.78 to 0.94) for women aged 50-64 years who did manual labor. The OR for vaccination was 1.17 times higher (95% CI, 1.04 to 1.31) for unemployed women aged 50-64 years and 1.70 times higher (95% CI, 1.12 to 2.60) for unemployed women aged 65 years or older. Among the subjects aged 50-64 years, the OR for vaccination was 1.31 times higher (95% CI, 1.01 to 1.70) for former smokers relative to current smokers, and 1.55 times higher (95% CI, 1.31 to 1.83) for non-smokers relative to current smokers. Among the subjects aged 65 years or older, the OR for vaccination was 1.61 times higher (95% CI, 1.12 to 2.32) and 1.73 times higher (95% CI, 1.29 to 2.33) for former smokers and non-smokers relative to current smokers, respectively. The vaccination coverage rate was 16.0% lower (95% CI, 0.78 to 0.90) for women aged 50-64 years who consumed alcohol and 11.0% lower (95% CI, 0.81 to 0.98) for women aged 65 years who consumed alcohol. The OR for vaccination was 1.15 times higher (95% CI, 1.08 to 1.22) for women aged 50-64 years who engaged in walking activities. Among the subjects aged 50-64 years, the vaccination coverage rate was 9.0% lower (95% CI, 0.84 to 0.98) for those with normal health statuses and 23.0% lower (95% CI, 0.70 to 0.84) for those who had good health statuses compared with those with poor health statuses. The vaccination coverage rate was 23.0% lower (95% CI, 0.67 to 0.90) for women aged 65 years or older who had good health statuses. The OR for vaccination was 2.07 times higher (95% CI, 1.91 to 2.25) for those aged 50-64 years and 2.36 times higher (95% CI, 2.13 to 2.60) for those aged 65 years or older who had health examinations. The OR for vaccination was 1.77 times higher for those aged 50-64 years (95% CI, 1.66 to 1.88) and 3.66 times higher (95% CI, 3.31 to 4.05) for those aged 65 years or older who visited public health centers.
- Table 5 shows the factors associated with chronic diseases that affect influenza vaccination among subjects aged 50 years older. The OR was 1.27 times higher (95% CI, 1.19 to 1.37) in the presence of hypertension and 1.41 times higher (95% CI, 1.28 to 1.55) in the presence of diabetes among men aged 50-64 years. Among men aged 65 years or older, the OR for vaccination was 1.34 times higher (95% CI, 1.20 to 1.49) for those with hypertension, 1.17 times higher (95% CI, 1.02 to 1.33) for those with diabetes and 1.31 times higher (95% CI, 1.07 to 1.60) for those with chronic cardiovascular diseases. Among women aged 50-64 years, the OR for vaccination was 1.39 times higher (95% CI, 1.30 to 1.49) for those with hypertension, 1.51 times higher (95% CI, 1.35 to 1.68) for those with diabetes and 1.31 times higher (95% CI, 1.05 to 1.64) for those with chronic cardiovascular diseases. Among women aged 65 years older, the OR for vaccination was 1.55 times higher (95% CI, 1.40 to 1.71) times higher for those with hypertension and 1.27 times higher (95% CI, 1.12 to 1.43) for those with diabetes.
- Influenza vaccination coverage rate according to whether or not subjects aged 50 years or older have at least one chronic disease in each region
- Regarding influenza vaccination coverage rates by cities and provinces, South Jeolla Province had the highest vaccination coverage rate of 44.1%, and Jeju Island had the lowest vaccination coverage rate of 31.4% for those aged 50-64 years (Table 6). Incheon Metropolitan City had the highest vaccination coverage rate of 54.3%, and Jeju Island had the lowest vaccination coverage rate of 36.3% for those with at least one chronic disease. North Chungcheong Province had the highest vaccination coverage rate of 89.5%, and Gwangju Metropolitan City had the lowest vaccination coverage rate of 81.4% for those aged 65 years or older. Sejong Metropolitan Autonomous City had the highest vaccination coverage rate of 92.5% followed by 91.5% in North Chungcheong Province, and South Gyeongsang Province had the lowest vaccination coverage rate of 84.2% for those with at least one chronic disease.
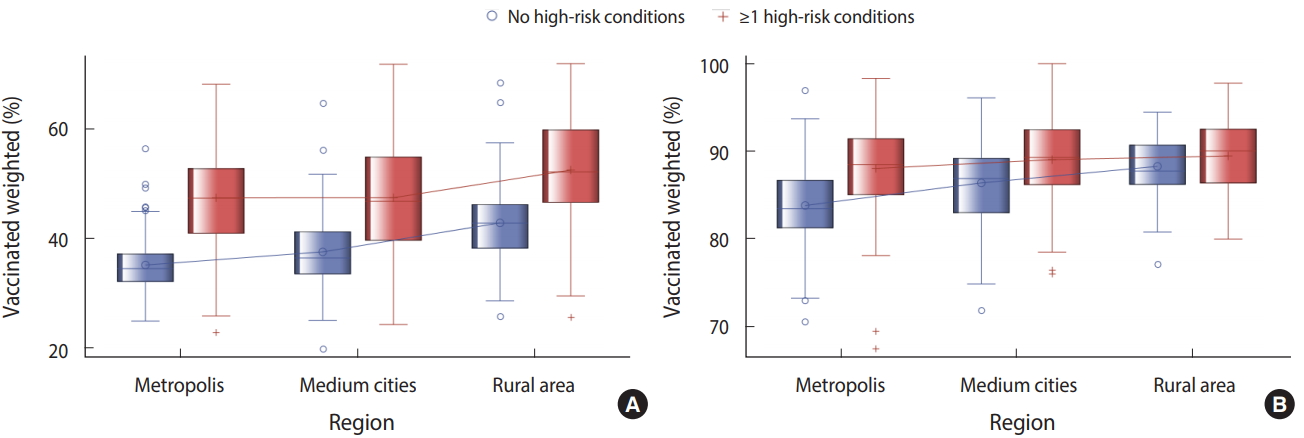
- Regarding the number of metropolis, medium cities, and rural areass that did not reach the target vaccination coverage rate of 80.0% set in 2015 for persons aged 65 years or older, 16 metropolis, 6 medium cities, and 1 rural area did not reach the target vaccination of 80.0% for persons without any chronic diseases. Five metropolis, 4 medium cities did not reach the target rate for those with at least one chronic disease (Figure 1).
RESULTS
- This study used the 2016 KCHS data to investigate influenza vaccination coverage rates and associated factors among subjects aged 50 years or older who responded to a questionnaire about influenza vaccination history in the last one year. The influenza vaccination coverage rates were investigated by regions and accompanying chronic diseases.
- In Korea, the scope of the National Immunization Program was expanded to civilian medical facilities in 2015, and its goal was set to reaching influenza vaccination coverage rates of 80.0% or higher for elderly persons aged 65 years or older [15]. The National Immunization Program provides free vaccination for persons aged 65 years or older and has helped reach high vaccination coverage rates of 80.0% or above. However, the vaccination coverage rate among men aged 65-69 years has been found to be 76.9%. Although persons aged 50-64 years were included in the priority vaccination group in 2003, vaccination coverage rates among men and women in this age group were found to be low at 30.5 and 43.8%, respectively. Therefore, policies and vaccination advertisements within communities are needed to increase vaccination coverage rates.
- In Korea, vaccination is recommended for priority vaccination groups before an influenza outbreak occurs. Medical staff, pregnant women, persons aged 50-64 years, elderly persons aged 65 years or older, and patients with chronic respiratory diseases, chronic heart diseases, chronic liver disease, chronic kidney disease, nerve-muscle disease, hemato-oncologic disease or diabetes are included in the priority group. Of these, those with chronic diseases are classified as high-risk groups.
- In this study, high vaccination coverage rates were found among subjects aged 50 years who had chronic diseases compared with those who did not. Consistent with overseas and domestic research findings, vaccination coverage rates increased as the number of chronic diseases increased among subjects with at least one chronic disease [16,17]. In addition, although persons aged 50-64 years who have chronic diseases and are thus classified as high-risk groups, or persons aged 65 years or older or persons with chronic diseases are at high-risk of severe influenza or complications, low vaccination coverage rates were found among subjects aged 50-64 years with chronic diseases. Since patients with chronic diseases have increased sensitivity to influenza infection, they are at higher risk for complications such as worsening of underlying diseases, pneumonia and impairment of other organs; as a result, their chronic diseases may become severe, or the patients may die. For this reason, influenza vaccination is important for these patient groups. Men aged 50 years or older with cerebrovascular diseases and women aged 50 years or older with diabetes showed high vaccination coverage rates. For both men and women, diabetes was identified as a factor that increased vaccination coverage rates. It appears vaccination coverage rates were higher among diabetic patients since these patients have reduced immunity against infections due to hyperglycemia and thus have serious accompanying complications such as pneumonia and septicemia.
- Regarding the health-related factors, high vaccination coverage rates were observed for both unemployed men and women, and the unemployment status was identified as a factor that increased vaccination coverage rates among subjects aged 65 years or older. In a previous study, being too busy for vaccination was one of the reasons for being unable to receive vaccination [18,19]. It is possible that the unemployed subjects had higher vaccination coverage rates since they could afford more time for vaccination. Regarding the marital status, higher vaccination coverage rates were found for married men and women, and the ‘married’ marital status was identified as a factor that increased vaccination coverage rate among men. A domestic study reported high vaccination coverage rates among those who lived with a spouse or a family and explained that social networks and vaccination recommendations by family members positively affect health information [6,20]. Except for men aged 65 years who smoked and consumed alcohol, which are bad life habits, vaccination coverage rates were low for both men and women. Consistent with a previous study, it appears that persons with healthy lifestyles tend to seek healthy behaviors and preventive treatments and are highly interested in influenza vaccination [13]. Both men and women who had health examinations and visited public health centers showed high vaccination coverage rates. Both having health examinations and visiting public health centers were identified as the factors that increased vaccination coverage rates. Of the factors related to the use of medical services, contact with medical staff during a treatment was found to positively affect vaccination [17,21]. It appears that people who undergo health examinations and visit public health centers show greater interest in the early prevention of diseases and health-promoting behaviors and thus show higher vaccination coverage rates.
- Regarding vaccination coverage rates by regions, high vaccination coverage rates were observed in metropolitan cities than provinces. It appears that cities show higher vaccination coverage rates since they allow easier access to medical institutions. It also appears that the expansion of the free vaccination services for persons aged 65 years or older to private medical institutions has increased vaccination coverage rates for those living in cities. Subjects living in metropolis, medium cities and rural areas who had at least one chronic disease showed high vaccination coverage rates. In all counties, the target vaccination coverage rate of 80.0% set in 2015 was reached for subjects aged 65 years or older with at least one chronic disease. The high vaccination coverage rates observed in counties were consistent with previous findings [22]. Vaccination advertisements and education have greater ripple effects in rural areas than cities since they are provided through community health centers in rural areas [23].
- This study had a number of limitations. First, the influenza vaccination status was investigated using a self-report questionnaire. Therefore, the investigated vaccination coverage rates may differ from the actual vaccination coverage rates, and they may be overestimated. Second, the possibility of recall bias that may have occurred when the subjects were asked about their influenza vaccination status in the last one year in the KCHS cannot be eliminated. Third, due to the limitations of the questionnaire, vaccination coverage rates for various chronic diseases with high-risk of influenza complications could not be investigated. Fourth, although health professionals’ recommendations and previous history of vaccination can significantly affect influenza vaccination among elderly persons and patients with chronic diseases, these variables could not be investigated as they were not included in the KCHS data [24].
- Despite these limitations, this study is meaningful in that it used survey data that considered regional characteristics to divide regions into metropolis, medium cities and rural areas and further divided the subjects into 50-64 and ≥65 years age groups to investigate vaccination coverage rates according to the chronic disease status and identify the factors that affect vaccination. The higher vaccination coverage rates observed for subjects aged 50-64 years who had at least one chronic disease compared to those who did not, and for subjects who lived in rural area than those who lived in medium cities indicate that active vaccination advertisements are needed to increase vaccination coverage rates among those aged 50-64 years who live in metropolis and medium cities. In addition, healthy professionals must recommend patients with chronic diseases who are aged 50-64 years to receive vaccination when they visit a health institution for a treatment.
DISCUSSION
SUPPLEMENTARY MATERIALS
| Age (yr) |
Men |
Women |
||
|---|---|---|---|---|
| Total | Vaccinated*** | Total | Vaccinated*** | |
| 50-54 | 10,018 | 2,359 (23.2) | 11,300 | 3,841(31.3) |
| 55-59 | 11,137 | 3,550 (29.8) | 13,370 | 6,332 (44.6) |
| 60-64 | 9,462 | 4,430 (43.1) | 11,189 | 6,998 (59.3) |
| 65-69 | 8,266 | 6,551 (76.9) | 9,841 | 8,401(83.3) |
| 70-74 | 7,195 | 6,327 (86.7) | 9,818 | 8,933 (90.4) |
| 75-79 | 6,193 | 5,591 (90.1) | 9,037 | 8,290 (91.1) |
| 80-84 | 3,373 | 3,054 (90.2) | 6,062 | 5,443 (88.8) |
| ≥85 | 1,273 | 1,088 (83.8) | 3,076 | 2,584 (84.0) |
| Variables |
Men |
Women |
||||||||||
|---|---|---|---|---|---|---|---|---|---|---|---|---|
|
50-64 yr |
p-value1 |
≥65 yr |
p-value1 |
50-64 yr |
p-value1 |
≥65 yr |
p-value1 | |||||
| Total | Vaccinated | Total | Vaccinated | Total | Vaccinated | Total | Vaccinated | |||||
| Total | 30,617 | 10,339 (30.5) | 26,300 | 22,611 (84.3) | <0.001 | 35,859 | 17,171 (43.8) | 37,834 | 33,651 (87.8) | <0.001 | ||
| Family income | ||||||||||||
| Low | 3,263 | 1,284 (35.9) | <0.001 | 11,795 | 10,289 (85.1) | 0.002 | 5,334 | 3,046 (52.1) | <0.001 | 22,135 | 19,816 (88.2) | 0.14 |
| Moderate-low | 11,587 | 4,184 (32.4) | 10,500 | 8,996 (85.0) | 15,205 | 7,686 (47.2) | 10,654 | 9,418 (87.6) | ||||
| Moderate-high | 9,230 | 2,795 (28.0) | 2,571 | 2,141 (81.5) | 9,117 | 3,884 (40.2) | 3,165 | 2,760 (86.4) | ||||
| High | 6,172 | 1,977 (30.3) | 1,247 | 1,038 (82.6) | 5,790 | 2,382 (39.4) | 1,608 | 1,424 (88.2) | ||||
| Education level | ||||||||||||
| ≤ Middle school | 9,322 | 3,952 (38.9) | <0.001 | 17,179 | 14,931 (85.0) | 0.06 | 17,703 | 10,060 (53.9) | <0.001 | 34,238 | 30,591 (88.2) | <0.001 |
| High school | 12,209 | 3,845 (29.5) | 5,927 | 5,021 (83.6) | 12,746 | 5,240 (39.6) | 2,604 | 2,245 (86.2) | ||||
| ≥ College | 8,998 | 2,517 (26.7) | 3,158 | 2,633 (83.3) | 5,315 | 1,824 (33.0) | 953 | 782 (83.4) | ||||
| Occupation | ||||||||||||
| White-collar | 6,497 | 1,951 (28.9) | <0.001 | 846 | 668 (79.5) | <0.001 | 3,191 | 1,178 (34.8) | <0.001 | 200 | 154 (79.5) | 0.003 |
| Blue-collar | 16,562 | 5,559 (29.4) | 9,692 | 8,420 (82.7) | 14,401 | 6,864 (41.0) | 8,322 | 7,499 (87.6) | ||||
| Unemployed | 7,464 | 2,788 (34.6) | 15,749 | 13,512 (85.1) | 18,231 | 9,114 (47.1) | 29,292 | 25,981 (87.9) | ||||
| Marital status | ||||||||||||
| Single | 1,127 | 324 (27.8) | <0.001 | 101 | 70 (64.1) | <0.001 | 484 | 190 (36.8) | <0.001 | 148 | 128 (90.2) | <0.001 |
| Married | 26,185 | 9,068 (31.2) | 22,941 | 19,891 (85.1) | 28,606 | 13,629 (43.3) | 17,142 | 15,419 (88.7) | ||||
| Other | 3,259 | 938 (25.7) | 3,234 | 2,634 (79.6) | 6,721 | 3,339 (46.3) | 20,527 | 18,090 (86.9) | ||||
| Smoking status | ||||||||||||
| Current smoker | 11,735 | 3,180 (24.4) | <0.001 | 5,207 | 4,124 (76.7) | <0.001 | 1,112 | 437 (36.0) | <0.001 | 785 | 647 (80.0) | <0.001 |
| Former smoker | 13,425 | 5,117 (34.3) | 15,634 | 13,785 (86.4) | 647 | 299 (41.6) | 1,157 | 994 (86.3) | ||||
| Non-smoker | 5,457 | 2,042 (34.2) | 5,456 | 4,699 (85.4) | 34,100 | 16,435 (44.1) | 35,891 | 32,009 (88.0) | ||||
| Drinking | ||||||||||||
| No | 1,988 | 767 (35.3) | <0.001 | 3,470 | 2,949 (83.8) | 0.52 | 9,207 | 4,815 (48.9) | <0.001 | 18,870 | 16,817 (88.3) | 0.03 |
| Yes | 28,629 | 9,572 (30.3) | 22,830 | 19,662 (84.4) | 26,647 | 12,353 (42.3) | 18,955 | 16,826 (87.3) | ||||
| Walking activity | ||||||||||||
| No | 18,185 | 6,118 (30.3) | 0.52 | 15,592 | 13,334 (83.2) | <0.001 | 21,651 | 10,173 (42.2) | <0.001 | 26,207 | 23,219 (87.4) | 0.06 |
| Yes | 12,409 | 4,208 (30.8) | 10,656 | 9,232 (85.5) | 14,183 | 6,982 (45.8) | 11,551 | 10,368 (88.4) | ||||
| Perceived health status | ||||||||||||
| Bad | 4,807 | 1,984 (37.9) | <0.001 | 9,522 | 8,333 (86.1) | <0.001 | 7,223 | 4,111 (52.7) | <0.001 | 20,057 | 17,955 (88.7) | <0.001 |
| Average | 13,524 | 4,586 (30.7) | 10,059 | 8,728 (85.3) | 18,033 | 8,703 (44.5) | 12,443 | 11,083 (88.2) | ||||
| Good | 12,281 | 3,767 (27.9) | 6,716 | 5,547 (80.8) | 10,598 | 4,356 (37.4) | 5,327 | 4,608 (84.0) | ||||
| Health screening | ||||||||||||
| No | 6,290 | 1,243 (17.6) | <0.001 | 4,772 | 3,361 (70.1) | <0.001 | 5,906 | 1,883 (29.5) | <0.001 | 8,364 | 6,574 (78.7) | <0.001 |
| Yes | 24,317 | 9,095 (33.7) | 21,508 | 19,235 (87.9) | 29,945 | 15,282 (46.7) | 29,417 | 27,032 (90.6) | ||||
| Public health centers use | ||||||||||||
| No | 22,315 | 5,863 (26.8) | <0.001 | 8,949 | 6,433 (74.8) | <0.001 | 22,385 | 8,727 (39.6) | <0.001 | 11,812 | 9,164 (80.4) | <0.001 |
| Yes | 8,299 | 4,476 (48.8) | 17,347 | 16,175 (93.0) | 13,470 | 8,442 (55.3) | 26,012 | 24,478 (94.0) | ||||
| Disease |
Men |
Women |
||||||||||
|---|---|---|---|---|---|---|---|---|---|---|---|---|
|
50-64 yr |
p-value1 |
≥65 yr |
p-value1 |
50-64 yr |
p-value1 |
≥65 yr |
p-value1 | |||||
| Total | Vaccinated | Total | Vaccinated | Total | Vaccinated | Total | Vaccinated | |||||
| Hypertension2 | ||||||||||||
| No | 21,080 | 6,513 (27.7) | <0.001 | 13,308 | 11,092 (81.2) | <0.001 | 26,192 | 11,598 (40.4) | <0.001 | 16,022 | 13,812 (84.5) | <0.001 |
| Yes | 9,533 | 3,824 (37.0) | 12,987 | 11,515 (87.3) | 9,665 | 5,573 (53.9) | 21,803 | 19,833 (90.2) | ||||
| Diabetes | ||||||||||||
| No | 26,119 | 8,392 (29.0) | <0.001 | 20,495 | 17,488 (83.5) | <0.001 | 32,356 | 15,000 (42.3) | <0.001 | 29,997 | 26,546 (87.1) | <0.001 |
| Yes | 4,495 | 1,947 (40.0) | 5,800 | 5,120 (86.7) | 3,498 | 2,171 (59.6) | 7,827 | 7,098 (90.2) | ||||
| Chronic cardiovascular disease | ||||||||||||
| No | 29,496 | 9,844 (30.2) | <0.001 | 23,832 | 20,382 (83.8) | <0.001 | 35,106 | 16,710 (43.5) | <0.001 | 34,950 | 31,046 (87.6) | 0.04 |
| Yes | 1,114 | 494 (40.0) | 2,443 | 2,210 (88.9) | 742 | 457 (59.3) | 2,807 | 2,545(89.5) | ||||
| Stroke | ||||||||||||
| No | 29,969 | 10,053 (30.3) | <0.001 | 24,444 | 21,019 (84.2) | 0.09 | 35,431 | 16,918 (43.6) | <0.001 | 35,824 | 31,896 (87.7) | 0.34 |
| Yes | 646 | 285 (42.0) | 1,846 | 1,584 (86.1) | 424 | 251 (55.7) | 1,997 | 1,744 (88.6) | ||||
| High-risk conditions3 | ||||||||||||
| No | 24,953 | 7,899 (28.6) | <0.001 | 17,773 | 15,094 (83.0) | <0.001 | 31,496 | 14,498 (42.0) | <0.001 | 26,762 | 23,666 (86.8) | <0.001 |
| ≥1 | 5,663 | 2,440 (39.8) | 8,526 | 7,517 (86.8) | 4,363 | 2,673 (58.7) | 11,072 | 9,985 (89.9) | ||||
| High-risk conditions4 | ||||||||||||
| No | 24,953 | 7,899 (28.6) | <0.001 | 17,773 | 15,094 (83.0) | <0.001 | 31,496 | 14,498 (42.0) | <0.001 | 26,762 | 23,666 (86.8) | <0.001 |
| 1 | 5,099 | 2,169 (39.3) | 7,093 | 6,241 (86.3) | 4,071 | 2,474 (58.2) | 9,608 | 8,664 (90.0) | ||||
| 2 | 536 | 256 (43.1) | 1,303 | 1,155 (89.0) | 283 | 192 (65.3) | 1,369 | 1,240 (90.0) | ||||
| 3 | 28 | 15 (53.8) | 130 | 121 (89.9) | 9 | 7 (88.7) | 95 | 81 (83.6) | ||||
Values are presented as number or number (weighted %).
1 Determined using the chi-square test.
2 Excluded from the high-risk group.
3 Adults with one or more of the following: diabetes, myocardial infarction or angina, stroke.
4 Adults who had at least one of the following: diabetes, myocardial infarction or angina, stroke.
| Variables |
Men |
Women |
||||||
|---|---|---|---|---|---|---|---|---|
|
50-64 yr |
≥65 yr |
50-64 yr |
≥65 yr |
|||||
| Crude OR (95% CI) | Adjusted OR (95% CI)1 | Crude OR (95% CI) | Adjusted OR (95% CI)1 | Crude OR (95% CI) | Adjusted OR (95% CI)1 | Crude OR (95% CI) | Adjusted OR (95% CI)1 | |
| Family income | ||||||||
| Low | 1.00 (reference) | 1.00 (reference) | 1.00 (reference) | 1.00 (reference) | 1.00 (reference) | 1.00 (reference) | 1.00 (reference) | 1.00 (reference) |
| Moderate-low | 0.86 (0.77, 0.96) | 0.90 (0.80, 1.03) | 0.99 (0.89, 1.10) | 1.02 (0.90, 1.15) | 0.82 (0.75, 0.89) | 096 (0.87, 1.05) | 0.94 (0.85, 1.04) | 1.04 (0.93, 1.16) |
| Moderate-high | 0.69 (0.62, 0.78) | 0.81 (0.70, 0.92) | 0.77 (0.67, 0.90) | 0.86 (0.73, 1.02) | 0.62 (0.56, 0.67) | 0.86 (0.77, 0.95) | 0.85 (0.73, 0.98) | 1.02 (0.87, 1.20) |
| High | 0.78 (0.69, 0.88) | 0.95 (0.82, 1.10) | 0.83 (0.69, 1.01) | 1.00 (0.80, 1.23) | 0.60 (0.54, 0.66) | 0.95 (0.84, 1.06) | 1.00 (0.83, 1.22) | 1.40 (1.14, 1.70) |
| Education level | ||||||||
| ≤ Middle school | 1.00 (reference) | 1.00 (reference) | 1.00 (reference) | 1.00 (reference) | 1.00 (reference) | 1.00 (reference) | 1.00 (reference) | 1.00 (reference) |
| High school | 0.66 (0.61, 0.71) | 0.71 (0.65, 0.77) | 0.90 (0.81, 1.00) | 0.94 (0.83, 1.06) | 0.56 (0.53, 0.60) | 0.66 (0.62, 0.71) | 0.83 (0.72, 0.96) | 0.95 (0.81, 1.11) |
| ≥ College | 0.57 (0.53, 0.62) | 0.57 (0.52, 0.63) | 0.88 (0.77, 100) | 0.95 (0.81, 1.11) | 0.42 (0.39, 0.46) | 0.53 (0.48, 0.58) | 0.67 (0.54, 0.84) | 0.79 (0.62, 1.00) |
| Occupation | ||||||||
| White-collar | 1.00 (reference) | 1.00 (reference) | 1.00 (reference) | 1.00 (reference) | 1.00 (reference) | 1.00 (reference) | 1.00 (reference) | 1.00 (reference) |
| Blue-collar | 1.03 (0.95, 1.11) | 0.86 (0.78, 0.94) | 1.23 (1.00, 1.51) | 0.94 (0.74, 1.19) | 1.30 (1.18, 1.45) | 0.87 (0.78, 0.98) | 1.83 (1.23, 2.73) | 1.21 (0.79, 1.87) |
| Unemployed | 1.31 (1.20, 1.42) | 1.05 (0.95, 1.17) | 1.48 (1.22, 1.79) | 1.41 (1.13, 1.77) | 1.67 (1.52, 1.85) | 1.17 (1.04, 1.31) | 1.87 (1.27, 2.76) | 1.70 (1.12, 2.60) |
| Marital status | ||||||||
| Single | 1.00 (reference) | 1.00 (reference) | 1.00 (reference) | 1.00 (reference) | 1.00 (reference) | 1.00 (reference) | 1.00 (reference) | 1.00 (reference) |
| Married | 1.18 (0.99, 1.40) | 1.23 (1.02, 1.47) | 3.20 (2.00, 5.14) | 3.49 (2.01, 6.05) | 1.31 (1.03, 1.67) | 1.04 (0.81, 1.34) | 0.85 (0.49, 1.48) | 0.60 (0.32, 1.11) |
| Other | 0.90 (0.74, 1.09) | 0.95 (0.77, 1.16) | 2.18 (1.34, 3.54) | 2.57 (1.47, 4.50) | 1.48 (1.16, 1.89) | 1.07 (0.83, 1.38) | 0.72 (0.41, 1.25) | 0.55 (0.30, 1.01) |
| Smoking status | ||||||||
| Current smoker | 1.00 (reference) | 1.00 (reference) | 1.00 (reference) | 1.00 (reference) | 1.00 (reference) | 1.00 (reference) | 1.00 (reference) | 1.00 (reference) |
| Former smoker | 1.61 (1.51, 1.73) | 1.48 (1.38, 1.60) | 1.93 (1.72, 2.15) | 1.61 (1.43, 1.81) | 1.26 (0.99, 1.61) | 1.31 (1.01, 1.70) | 1.57 (1.12, 2.21) | 1.61 (1.12, 2.32) |
| Non-smoker | 1.61(1.47, 1.75) | 1.56 (1.42, 1.72) | 1.77 (1.54, 2.04) | 1.57 (1.34, 1.82) | 1.40 (1.20, 1.63) | 1.55 (1.31, 1.83) | 1.83 (1.40, 2.39) | 1.73 (1.29, 2.33) |
| Drinking | ||||||||
| No | 1.00 (reference) | 1.00 (reference) | 1.00 (reference) | 1.00 (reference) | 1.00 (reference) | 1.00 (reference) | 1.00 (reference) | 1.00 (reference) |
| Yes | 0.80 (0.70, 0.90) | 0.81 (0.71, 0.92) | 1.05 (0.91, 1.20) | 0.96 (0.81, 1.12) | 0.77 (0.72, 0.82) | 0.84 (0.78, 0.90) | 0.91 (0.83, 0.99) | 0.89 (0.81, 0.98) |
| Walking activity | ||||||||
| No | 1.00 (reference) | 1.00 (reference) | 1.00 (reference) | 1.00 (reference) | 1.00 (reference) | 1.00 (reference) | 1.00 (reference) | 1.00 (reference) |
| Yes | 1.02 (0.96, 1.09) | 1.00 (0.94, 1.07) | 1.19 (1.08, 1.31) | 1.20 (1.08, 1.33) | 1.16 (1.09, 1.22) | 1.15 (1.08, 1.22) | 1.09 (1.00, 1.20) | 1.06 (0.96, 1.18) |
| Perceived health status | ||||||||
| Bad | 1.00 (reference) | 1.00 (reference) | 1.00 (reference) | 1.00 (reference) | 1.00 (reference) | 1.00 (reference) | 1.00 (reference) | 1.00 (reference) |
| Average | 0.73 (0.66, 0.80) | 0.91 (0.82, 100) | 0.93 (0.83, 1.05) | 0.94 (0.83, 1.07) | 0.72 (0.67, 0.77) | 0.91 (0.84, 0.98) | 0.96 (0.86, 1.05) | 0.99 (0.89, 1.11) |
| Good | 0.63 (0.58, 0.69) | 0.84 (0.75, 0.93) | 0.68 (0.61, 0.77) | 0.70 (0.61, 0.81) | 0.54 (0.49, 0.58) | 0.77 (0.70, 0.84) | 0.67 (0.59, 0.76) | 0.77 (0.67, 0.90) |
| Health screening | ||||||||
| No | 1.00 (reference) | 1.00 (reference) | 1.00 (reference) | 1.00 (reference) | 1.00 (reference) | 1.00 (reference) | 1.00 (reference) | 1.00 (reference) |
| Yes | 2.39 (2.20, 2.61) | 2.29 (2.09, 2.51) | 3.09 (2.79, 3.43) | 2.68 (2.39, 3.00) | 2.10 (1.94, 2.27) | 2.07 (1.91, 2.25) | 2.60 (2.38, 2.86) | 2.36 (2.13, 2.60) |
| Public health centers use | ||||||||
| No | 1.00 (reference) | 1.00 (reference) | 1.00 (reference) | 1.00 (reference) | 1.00 (reference) | 1.00 (reference) | 1.00 (reference) | 1.00 (reference) |
| Yes | 2.61 (2.43, 2.80) | 2.36 (2.19, 2.54) | 4.52 (4.06, 5.02) | 4.31 (3.85, 4.82) | 1.89 (1.78, 2.00) | 1.77 (1.66, 1.88) | 3.80 (3.46, 4.18) | 3.66 (3.31, 4.05) |
| Variable |
Men |
Women |
||||||
|---|---|---|---|---|---|---|---|---|
|
50-64 yr |
≥65 yr |
50-64 yr |
≥65 yr |
|||||
| Crude OR (95% CI) | Adjusted OR (95% CI)1 | Crude OR (95% CI) | Adjusted OR (95% CI)1 | Crude OR (95% CI) | Adjusted OR (95% CI)1 | Crude OR (95% CI) | Adjusted OR (95% CI)1 | |
| Hypertension2 | ||||||||
| No | 1.00 (reference) | 1.00 (reference) | 1.00 (reference) | 1.00 (reference) | 1.00 (reference) | 1.00 (reference) | 1.00 (reference) | 1.00 (reference) |
| Yes | 1.53 (1.43, 1.63) | 1.27 (1.19, 1.37) | 1.59 (1.44, 1.75) | 1.34 (1.20, 1.49) | 1.73 (1.62, 1.84) | 1.39 (1.30, 1.49) | 1.69 (1.54, 1.85) | 1.55 (1.40, 1.71) |
| Diabetes | ||||||||
| No | 1.00 (reference) | 1.00 (reference) | 1.00 (reference) | 1.00 (reference) | 1.00 (reference) | 1.00 (reference) | 1.00 (reference) | 1.00 (reference) |
| Yes | 1.63 (1.50, 1.77) | 1.41 (1.28, 1.55) | 1.29 (1.14, 1.45) | 1.17 (1.02, 1.33) | 2.02 (1.83, 2.22) | 1.51 (1.35, 1.68) | 1.37 (1.22, 1.53) | 1.27 (1.12, 1.43) |
| Chronic cardiovascular disease | ||||||||
| No | 1.00 (reference) | 1.00 (reference) | 1.00 (reference) | 1.00 (reference) | 1.00 (reference) | 1.00 (reference) | 1.00 (reference) | 1.00 (reference) |
| Yes | 1.54 (1.32, 1.81) | 1.11 (0.94, 1.32) | 1.55 (1.29, 1.87) | 1.31 (1.07, 1.60) | 1.89 (1.56, 2.30) | 1.31 (1.05, 1.64) | 1.20 (1.00, 1.44) | 1.09 (0.90, 1.32) |
| Stroke | ||||||||
| No | 1.00 (reference) | 1.00 (reference) | 1.00 (reference) | 1.00 (reference) | 1.00 (reference) | 1.00 (reference) | 1.00 (reference) | 1.00 (reference) |
| Yes | 1.67 (1.36, 2.04) | 1.22 (0.97, 1.53) | 1.17 (0.98, 1.40) | 1.04 (0.85, 1.27) | 1.62 (1.24, 2.12) | 1.18 (0.90, 1.55) | 1.09 (0.91, 1.32) | 0.98 (0.80, 1.19) |
| Variables |
50-64 yr |
≥65 yr |
||||||
|---|---|---|---|---|---|---|---|---|
|
No high-risk conditions |
≥1 high-risk conditions1 |
No high-risk conditions |
≥1 high-risk conditions1 |
|||||
| Total | Vaccinated | Total | Vaccinated | Total | Vaccinated | Total | Vaccinated | |
| Nationwide | 56,449 | 22,397 (35.6) | 10,026 | 5,113 (47.2) | 44,535 | 38,760 (85.2) | 19,598 | 17,502 (88.5) |
| Seoul Metropolitan City | 5,429 | 1,840 (32.6) | 801 | 366 (42.1) | 3,073 | 2,590 (84.4) | 1,405 | 1,257(89.4) |
| Busan Metropolitan City | 3,736 | 1,306 (33.3) | 657 | 326 (48.3) | 2,283 | 1,880 (82.0) | 1,166 | 1,007 (85.8) |
| Daegu Metropolitan City | 1,735 | 638 (34.9) | 288 | 145 (49.5) | 1,170 | 985 (83.1) | 507 | 453 (89.0) |
| Incheon Metropolitan City | 2,148 | 937 (38.2) | 400 | 223 (54.3) | 1,449 | 1,255 (83.0) | 700 | 624(86.8) |
| Gwangju Metropolitan City | 1,062 | 374 (33.9) | 148 | 70 (47.4) | 595 | 494 (81.4) | 297 | 255 (86.8) |
| Daejeon Metropolitan City | 1,088 | 381 (34.6) | 175 | 86 (48.0) | 532 | 448 (82.8) | 287 | 255 (87.5) |
| Ulsan Metropolitan City | 1,172 | 488 (40.4) | 176 | 86 (47.4) | 461 | 394 (85.1) | 222 | 195 (87.1) |
| Gyeonggi-do | 9,779 | 3,561 (35.0) | 1,595 | 754 (46.2) | 4,931 | 4,238 (86.0) | 2,379 | 2,136 (89.7) |
| Gangwon-do | 4,348 | 1,785 (37.8) | 895 | 445 (46.1) | 3,325 | 2,880 (86.1) | 1,553 | 1,385 (87.2) |
| Chungcheongbuk-do | 3,221 | 1,388 (39.1) | 661 | 370 (49.7) | 2,640 | 2,355 (89.5) | 1,228 | 1,136 (91.5) |
| Chungcheongnam-do | 3,361 | 1,487 (40.0) | 694 | 369 (47.2) | 3,183 | 2,839 (88.9) | 1,370 | 1,233 (89.2) |
| Jeollabuk-do | 2,928 | 1,409 (41.1) | 549 | 326 (52.2) | 3,618 | 3,268 (88.0) | 1,525 | 1,398 (90.6) |
| Jeollanam-do | 4,585 | 2,219 (44.1) | 971 | 564 (52.5) | 6,006 | 5,385 (87.5) | 2,530 | 2,279 (89.1) |
| Gyeongsangbuk-do | 5,756 | 2,279 (35.1) | 990 | 495 (48.6) | 5,794 | 5,101 (86.6) | 2,368 | 2,087 (88.2) |
| Gyeongsangnam-do | 4,604 | 1,829 (35.5) | 811 | 395 (45.9) | 4,233 | 3,579 (83.4) | 1,607 | 1,402 (84.2) |
| Jeju Island | 1,321 | 410 (31.4) | 177 | 73 (36.3) | 1,101 | 950 (84.7) | 390 | 341 (86.9) |
| Sejong Metropolitan Autonomous City | 176 | 66 (34.2) | 38 | 20 (48.0) | 141 | 119 (82.3) | 64 | 59 (92.5) |
- 1. Baek JH, Seo YB, Choi WS, Kee SY, Jeong HW, Lee HY, et al. Guideline on the prevention and control of seasonal influenza in healthcare setting. Korean J Intern Med 2014;29:265-280.ArticlePubMedPMC
- 2. National Health Insurance Sharing Service. Disease statistics. [cited 2017 Dec 28]. Available from: https://nhiss.nhis.or.kr/bd/ad/bdada033cv.do(Korean).
- 3. Korean Statistical Information Service. Population resident registration (2011-) by administrative area (eup, myeon-dong)/5 years old. [cited 2018 May 11]. Available from: http://kosis.kr/statHtml/statHtml.do?orgId=101&tblId=DT_1B04005N&conn_path=I3(Korean).
- 4. Casanova L, Gobin N, Villani P, Verger P. Bias in the measure of the effectiveness of seasonal influenza vaccination among diabetics. Prim Care Diabetes 2016;10:398-406.ArticlePubMed
- 5. Korea Centers for Disease Control and Prevention. Seasonal influenza national immunization program support project management guidelines for medical institutes, 2017-2018. [cited 2017 Dec 15]. Available from: http://www.cdc.go.kr/CDC/notice/CdcKrTogether0302.jsp?menuIds=HOME001-MNU1154-MNU0005-MNU0088&cid=75943(Korean).
- 6. Kwon DS, Kim K, Park SM. Factors associated with influenza vaccination coverage among the elderly in South Korea: the fourth Korean National Health and Nutrition Examination Survey (KNHANES IV). BMJ Open 2016;6:e012618.ArticlePubMedPMC
- 7. Park YH, Kim BK, Jang WK, Choi BG, Lim SM, Kim EJ. A study on the supply and demand of influenza vaccine in Korea. J Soonchunhyang Med Sci 2009;15:35-44 (Korean).
- 8. Korea Centers for Disease Control and Prevention. Influenza vaccination. [cited 2017 Dec 12]. Available from: http://www.cdc.go.kr/CDC/contents/CdcKrContentView.jsp?cid=68455&menuIds=HOME001-MNU1132-MNU2430-MNU2432-MNU2464 (Korean).
- 9. Centers for Disease Control and Prevention. Flu vaccination coverage, United States, 2015-16 influenza season. [cited 2017 Dec 12]. Available from: https://www.cdc.gov/flu/fluvaxview/coverage-1516estimates.htm.
- 10. Korea Centers for Disease Control and Prevention. Korea health statistics 2015. [cited 2017 Dec 22]. Available from: https://knhanes.cdc.go.kr/knhanes/main.do (Korean).
- 11. Shin HN. Status of influenza vaccination among Korean adults over 50 years and its related factors. [dissertation]. Seoul: Yonsei University; 2013. (Korean).
- 12. Byeon GR, Hur YI, Kang JH, Park HA, Kim KW, Cho YG, et al. Influenza vaccination status in Korean adult population in relation with socioeconomic and medical factors. Korean J Health Promot 2016;16:20-31 (Korean).Article
- 13. Lee KC, Han K, Kim JY, Nam GE, Han BD, Shin KE, et al. Socioeconomic status and other related factors of seasonal influenza vaccination in the South Korean adult population based on a nationwide cross-sectional study. PLoS One 2015;10:e0117305.ArticlePubMedPMC
- 14. Korea Centers for Disease Control and Prevention. Community Health Survey. [cited 2018 May 7]. Available from: https://chs.cdc.go.kr/chs/index.do (Korean).
- 15. Lee HY, Yu JH, Hong JI. Elderly immunization program against influenza in Korea, 2015; 2016 [cited 2018 May 12]. Available from: http://www.cdc.go.kr/CDC/info/CdcKrInfo0301.jsp?menuIds=HOME001-MNU1154-MNU0005-MNU0037-MNU1380&cid=67630 (Korean).
- 16. Annunziata K, Rak A, Del Buono H, DiBonaventura M, Krishnarajah G. Vaccination rates among the general adult population and high-risk groups in the United States. PLoS One 2012;7:e50553.ArticlePubMedPMC
- 17. O’Halloran AC, Lu PJ, Williams WW, Bridges CB, Singleton JA. Influenza vaccination coverage among people with high-risk conditions in the US. Am J Prev Med 2016;50:e15-e26.ArticlePubMed
- 18. Kee SY, Lee JS, Cheong HJ, Chun BC, Song JY, Choi WS, et al. Influenza vaccine coverage rates and perceptions on vaccination in South Korea. J Infect 2007;55:273-281.ArticlePubMedPMC
- 19. Kroneman M, van Essen GA, John Paget W. Influenza vaccination coverage and reasons to refrain among high-risk persons in four European countries. Vaccine 2006;24:622-628.ArticlePubMed
- 20. Cho HM, Kim JY, Hwang SE, Kim JC, Kim MY, Lee SH. Association between living arrangements and influenza vaccination rates among elderly south Korean people: the fifth Korea National Health and Nutrition Examination Survey (KNHANES V-2). Korean J Fam Med 2015;36:186-190.ArticlePubMedPMC
- 21. Wahid ST, Nag S, Bilous RW, Marshall SM, Robinson AC. Audit of influenza and pneumococcal vaccination uptake in diabetic patients attending secondary care in the Northern Region. Diabet Med 2001;18:599-603.ArticlePubMed
- 22. Ryu SY, Kim SH, Park HS, Park J. Influenza vaccination among adults 65 years or older: a 2009-2010 community health survey in the Honam region of Korea. Int J Environ Res Public Health 2011;8:4197-4206.ArticlePubMedPMC
- 23. Park MB, Kim CB, Joo HS. Factors influencing on influenza vaccination coverage. J Korea Contents Assoc 2013;13:300-311 (Korean).Article
- 24. Yeung MP, Lam FL, Coker R. Factors associated with the uptake of seasonal influenza vaccination in adults: a systematic review. J Public Health (Oxf) 2016;38:746-753.ArticlePubMedPDF
REFERENCES
Figure & Data
References
Citations
- All-Cause and Cause-Specific Mortality Attributable to Seasonal Influenza: A Nationwide Matched Cohort Study
Heeseon Jang, Jaelim Cho, Seong-Kyung Cho, Donghan Lee, Sung-il Cho, Sang-Baek Koh, Dong-Chun Shin, Changsoo Kim
Journal of Korean Medical Science.2023;[Epub] CrossRef - Cost-Effectiveness of Influenza Vaccination Strategies in Adults: Older Adults Aged ≥65 Years, Adults Aged 50–64 Years, and At-Risk Adults Aged 19–64 Years
Min Joo Choi, Gyeongseon Shin, Daewon Kang, Jae-Ok Lim, Yun-Kyung Kim, Won Suk Choi, Jae-Won Yun, Ji Yun Noh, Joon Young Song, Woo Joo Kim, Sang-Eun Choi, Hee Jin Cheong
Vaccines.2022; 10(3): 445. CrossRef - Assessing Vaccine Protection for Older Adults with Diabetes: A Systematic Review
Leena Almasri, Barbara J. Holtzclaw
Western Journal of Nursing Research.2022; 44(6): 582. CrossRef - Drivers of and barriers to routine adult vaccination: A systematic literature review
Amanda L. Eiden, Jane Barratt, Mawuli K. Nyaku
Human Vaccines & Immunotherapeutics.2022;[Epub] CrossRef - Factors associated with influenza vaccination coverage and willingness in the elderly with chronic diseases in Shenzhen, China
Hongbiao Chen, Qiushuang Li, Minyi Zhang, Zihao Gu, Xiaofeng Zhou, He Cao, Fei Wu, Minyi Liang, Liting Zheng, Juxian Xian, Qing Chen, Qihui Lin
Human Vaccines & Immunotherapeutics.2022;[Epub] CrossRef - The role of health determinants in the influenza vaccination uptake among older adults (65+): a scope review
Regina Roller-Wirnsberger, Sonja Lindner, Lea Kolosovski, Elisabeth Platzer, Peter Dovjak, Holger Flick, Chariklia Tziraki, Maddalena Illario
Aging Clinical and Experimental Research.2021; 33(8): 2123. CrossRef - Factors Related to Influenza Vaccination Intention in University Students Based on Theory of Planned Behavior
Yeojoo Chae, Sunjoo Kim, Seungkyoung Yang
Journal of Health Informatics and Statistics.2021; 46(1): 64. CrossRef - Analysis of Epidemiological and Clinical Characteristics of COVID-19 in Northwest Mexico and the Relationship Between the Influenza Vaccine and the Survival of Infected Patients
Uriel A. Angulo-Zamudio, Francisco M. Martínez-Villa, Nidia Leon-Sicairos, Hector Flores-Villaseñor, Jorge Velazquez-Roman, Abraham Campos-Romero, Jonathan Alcántar-Fernández, Francisco Urrea, Secundino Muro-Amador, Julio Medina-Serrano, Jesus J. Martinez
Frontiers in Public Health.2021;[Epub] CrossRef - Influenza Vaccination Coverage among Older Adults with Hypertension in Shenzhen, China: A Cross-Sectional Survey during the COVID-19 Pandemic
Qiushuang Li, Minyi Zhang, Hongbiao Chen, Fei Wu, Juxian Xian, Liting Zheng, Minyi Liang, He Cao, Xiaofeng Zhou, Zihao Gu, Qihui Lin, Qing Chen
Vaccines.2021; 9(10): 1105. CrossRef - A Nationwide Survey on the Hospital Vaccination Policies in Korea
Sun Hee Park, Mi Suk Lee, Sung Ran Kim, Yee Gyung Kwak
Journal of Korean Medical Science.2020;[Epub] CrossRef - Possibilities for Coronavirus (COVID 19) – The Perspectives
Mark Christopher Arokiaraj
SSRN Electronic Journal .2020;[Epub] CrossRef - Correlation of Influenza Vaccination and the COVID-19 Severity
Mark Christopher Arokiaraj
SSRN Electronic Journal .2020;[Epub] CrossRef - Considering Interim Interventions to Control COVID-19 Associated Morbidity and Mortality—Perspectives
Mark Christopher Arokiaraj
Frontiers in Public Health.2020;[Epub] CrossRef - Increasing Influenza Vaccination Rates in People With Chronic Illness
Linda Sanftenberg, Felix Brombacher, Jörg Schelling, Stefanie J. Klug, Jochen Gensichen
Deutsches Ärzteblatt international.2019;[Epub] CrossRef
 PubReader
 ePub Link
 Cite
Cite

