
Articles
- Page Path
- HOME > Epidemiol Health > Volume 33; 2011 > Article
-
Original Article
ADIPOQ Gene Variants Associated with Susceptibility to Obesity and Low Serum Adiponectin Levels in Healthy Koreans - Ji Wan Park1, Jungyong Park2, Sun Ha Jee3,4
-
Epidemiol Health 2011;33:e2011003.
DOI: https://doi.org/10.4178/epih/e2011003
Published online: April 25, 2011
1Department of Medical Genetics, College of Medicine, Hallym University, Chuncheon, Korea.
2Institute for Health Promotion, Graduate School of Public Health, Yonsei University, Seoul, Korea.
3Department of Epidemiology and Health Promotion, Graduate School of Public Health, Yonsei University, Seoul, Korea.
4Metabolic Syndrome Research Initiatives, Seoul, Korea.
- Correspondence: Sun Ha Jee, MPH, PhD. Department of Epidemiology and Health Promotion, Graduate School of Public Health, Yonsei University, 250 Seongsan-ro, Seodaemun-gu, Seoul 120-752, Korea. Tel: +82-2-2228-1523, Fax: +82-2-365-5118, jsunha@yuhs.ac
© 2011, Korean Society of Epidemiology
This is an open-access article distributed under the terms of the Creative Commons Attribution License (http://creativecommons.org/licenses/by/3.0), which permits unrestricted use, distribution, and reproduction in any medium, provided the original work is properly cited.
- 18,230 Views
- 123 Download
- 18 Crossref
Abstract
-
OBJECTIVES
- This study aimed to measure the association between the adiponectin, C1Q and collagen domain-containing (ADIPOQ) gene variants and obesity in Koreans.
-
METHODS
- Three single nucleotide polymorphisms located in the ADIPOQ gene were genotyped in a population-based cross-sectional study of 986 healthy Koreans. Three different case-control groups (i.e. G1, G2, and G3) were defined according to body mass index (BMI) and serum adiponectin levels. Allelic and genotypic associations of this gene with obesity were measured using multivariate logistic regression analyses in each group.
-
RESULTS
- The G allele of -11377C>G, a polymorphism located in the promoter region of the ADIPOQ gene (odds ratio (OR), 1.48; 95% confidence interval, 1.13-1.94) and most haplotypes including this allele significantly increased the risk for obesity. However, the OR decreased from 3.98 (G1 group) to 2.90 (G2 group) and 2.30 (G3 group) when a less strict definition of obesity was used. Most haplotypes, including this allele, significantly increased the risk of obesity. The statistical evidence from the GG genotype of -11377C>G (OR, 3.98) and the GT/GT diplotype composed of -11377G>C and +45T>G (OR, 5.20) confirmed the contribution of the G allele toward a predisposition for obesity.
-
CONCLUSION
- These results suggest the contribution of the ADIPOQ gene toward susceptibility to obesity in healthy Koreans. The high-risk genotypes and haplotypes identified here may provide more information for identifying individuals who are at risk of obesity.
- Obesity is a prevalent condition and a modifiable risk factor for various complex diseases, including diabetes and cardiovascular disease. Although the current World Health Organization (WHO) definitions for being overweight and obesity are body mass index (BMI) of ≥25-29.9 kg/m2 and ≥30 kg/m2, respectively, different BMI cut-off points of 23-24.9 kg/m2 and ≥25 kg/m2, respectively, were suggested for the Asian population [1,2]. In Korea, the prevalence of obesity (BMI ≥25 kg/m2) has dramatically increased over the past decade and the third Korea National Health & Nutrition Examination Survey reported that the overall prevalence of obesity in Korean adults was 30.6% (29.4% in women and 32.4% in men) in 2001 [3].
- Adiponectin decreases body weight by increasing lipid oxidation in muscles and other organs such as the pancreas and liver [4]. The concentration of adiponectin in plasma was shown to be negatively correlated with BMI [5]. In humans, adiponectin is encoded by portions of exons 2 and 3 among the three exons of the adiponectin, C1Q and collagen domain-containing (ADIPOQ) gene (also denoted as APM1 or ACDC) located on chromosome 3q27 [6]. The 13 single nucleotide polymorphisms (SNPs) in the ADIPOQ gene were previously reported in Japanese and French populations [7]. Two SNPs located on exon 2 (+45T>G, a synonymous mutation, Gly15Gly) and intron 2 (+276G>T) of the ADIPOQ gene were reported to be associated with both plasma adiponectin concentrations and type 2 diabetes (T2D) in Japanese, German, and Italian populations [7-9]. The G allele of the SNP -11377C>G located in the promoter region was also shown to be associated with lower adiponectin levels and severe obesity among Danish women [10]. Neither the mechanism responsible for controlling the synthesis of adiponectin nor the regulation of ADIPOQ gene expression have been fully determined as yet. The effect of the ADIPOQ gene on the risk of obesity may vary according to ethnicity, age, and he degree of obesity across populations [11].
- Thus, this study aimed to perform an analysis of the association between the ADIPOQ gene and BMI, an index of obesity, whilst considering plasma adiponectin levels in a Korean population. We defined three groups of two extremes for comparison according to a combination of BMI levels and plasma adiponectin concentrations after adjusting for age and sex in 986 healthy Koreans.
INTRODUCTION
- Study subjects
- The study population consisted of 10,169 subjects who had participated in routine health examinations at the Health Promotion Center, Yonsei University Severance Hospital during the period of April 2006 to July 2008. The analyses excluded subjects with any disease, including diabetics (with fasting serum glucose ≥126 mg/dL), and those with prior usage of lipid-lowering drugs, as well as all participants with missing information on BMI or adiponectin levels. Finally, 986 subjects, aged 21 to 81 yr old, were genotyped for subsequent analyses. The Institutional Review Board of Human Research of Yonsei University approved the study, and written informed consent was obtained from all subjects before participation.
- Data collection
- Each participant was interviewed using a structured questionnaire to collect histories of cigarette smoking (non-smoker, ex-smoker, or current smoker) and alcohol consumption (non-drinker or any alcohol drinker), as well as other demographic characteristics such as age and gender. The weight and height of each participant were measured in light clothing. The BMI was calculated as weight (kg) divided by height squared (m2).
- Measurement of biomarkers
- For the clinical chemistry assay, serum was separated from peripheral venous blood samples obtained from each participant after 12 hr of fasting and stored at -70℃. Biomarkers for metabolic syndrome, such as fasting blood glucose, were measured using a Hitachi-7600 analyzer (Hitachi Ltd., Tokyo, Japan). The adiponectin level was measured using an enzyme-linked immunosorbent assay (ELISA; B-Bridge International Inc., Sunnyvale, CA, USA). Data quality control was performed in accordance with the procedures of the Korean Association of Laboratory Quality Control.
- Genotyping of SNPs
- Genomic DNA was isolated from lymphocytes by using a DNA isolation kit according to the protocol of the manufacturer (WIZARD Genomic DNA purification kit; Promega Corp., Madison, WI, USA). In several populations other than Korean, three SNPs in the ADIPOQ gene were found to be associated with the levels of adiponectin and obesity [11]. Thus, the SNPs -11377C>G (rs266729), +45T>G (rs2241766), and +276G>T (rs1501299) were genotyped using the SNP-IT™ (SNP-Identification Technology) assay with the SNPstream 25K® System (Orchid Biosciences, Princeton, NJ, USA), as previously described [12]. The development of blue and/or yellow colors corresponding to two alleles was analyzed with an ELISA reader and the final genotype calling was made by the QC Review™ program (Orchid Biosciences). The genotyping success rate was an average of 99.12% and four duplicates of control DNA on each plate showed a 99% consistency rate for the genotype calling.
- Statistical analysis
- Analysis of variance (ANOVA) was used to evaluate whether these three SNPs were associated with plasma adiponectin concentration and BMI. Variations in these SNPs were significantly associated with adiponectin level and BMI (data not shown). Although obesity was not defined according to the WHO definition (i.e. a BMI of 25 kg/m2 or higher for Asians) in this study, obesity is known to positively correlate with BMI and reversely correlate with the level of adiponectin, and the ADIPOQ gene is the gene of interest as a susceptibility gene of obesity [13]. Therefore, we divided our study subjects into five groups (quintiles) of BMI (<22.7, 22.7-24.1, 24.2-25.4, 25.5-26.9, and ≥27.0 kg/m2 for men and <21.2, 21.2-22.8, 22.9-24.0, 24.1-25.5, and ≥25.6 kg/m2 for women) and five groups of adiponectin (<3.7, 3.8-4.7, 4.8-6.0, 6.1-7.9, and ≥8.0 µg/mL for men and <5.6, 5.6-7.1, 7.2-9.1, 9.2-12.1, and ≥12.2 µg/mL for women), respectively. We then defined three different comparison groups according to both the level of BMI and the plasma adiponectin concentration to compare obese individuals versus slim individuals, as shown in Figure 1 (i.e. G1, G2, and G3).
- The minor allele frequency (MAF) and a chi-square test for the Hardy-Weinberg equilibrium (HWE) at each SNP, and the pair-wise linkage disequilibrium (LD) by both D' and r2 were computed among the controls of the G3 group using the Haploview program [14]. In order to measure the risk of obesity for alleles and genotypes of individual SNPs, as well as for haplotypes and diplotypes composed of two or three SNPs, multiple logistic regression models were tested in each of the three comparison groups after adjusting for age and other potential confounding factors such as gender, smoking status, and alcohol consumption. Genotypic odds ratios (GORs) and 95% confidence intervals (95% CIs) for heterozygotes and homozygotes were calculated separately, and then the best genetic model for each marker was determined using the Stata version 9.0 (StataCorp, College Station, TX, USA). To determine whether an insignificant result observed in the genotypic test was caused by a type II error, the power was computed using the web browser 'Genetic Power Calculator' [15].
MATERIALS AND METHODS
- As shown in Table 1, 73.1% of the study population was composed of men (with a mean age of 49.5 yr old), and 26.9% of the population was female (mean: 51.2 yr old). The average BMI values were 24.8 and 23.6 kg/m2 for men and women, respectively. The plasma adiponectin level was approximately 30% higher in women (9.1 µg/mL) than in men (6.2 µg/mL). No gender difference was observed in the homeostasis model assessment of insulin resistance (HOMA-IR) levels. As shown Figure 1, the numbers of cases and controls increased from G1 (55 cases, 71 controls) to G3 (259 cases, 272 controls).
- The major alleles for each marker of -11377C>G, +45T>G, and +276G>T in the controls of the G3 group were C, T, and G, respectively. All three markers showed sufficient heterozygosity, and no evidence of deviation from HWE was observed in any marker (Table 2). Three SNPs were not found to be in strong linkage disequilibrium based on the values of r2. Although individuals with the GG genotype of -11377C>G had a higher BMI and lower adiponectin concentration (25.1 kg/m2 and 6.7 µg/mL) compared to individuals with the CC reference genotype (24.4 kg/m2 and 7.1 µg/mL), the difference was not statistically significant (p=0.09) (Table 3).
- Allelic and genotypic odds ratios for individual SNPs
- As shown in Table 4, the G allele and the GG genotype of the -11377C>G SNP significantly increased the risk of obesity (OR, 1.48 and 2.30, respectively, in the G3 group), although the regression model for the genotypic test was marginally significant (p=0.06). However, the OR decreased as the number of subjects increased (i.e. when the less strict definition of obesity was used) from 3.98 (group G1) to 2.90 (group G2) and 2.30 (group G3). The GG homozygotes of +45T>G showed a significantly low OR of 0.10, but only one case and eleven controls were available in the G1 group. The TT homozygotes of +276G>T were found to increase the risk of obesity, but this finding was not statistically significant. A recessive mode of inheritance was the best-fit to our data for all three markers in the most extreme comparison group of obesity (i.e. the G1 group) (data not shown). To test whether or not the number of subjects was sufficient to detect the effect size for each genotype, we modeled our study power under a recessive mode of inheritance. The G3 group composed of 259 cases and 272 controls achieved 80% power to significantly detect the OR over 2.29 and 2.06 under the assumption of disease prevalence, 30%; and disease allele frequencies, 0.24 and 0.28, respectively. In the current study, the ADIPOQ gene variants did not show a consistent trend of increasing or decreasing obesity for age. For instance, the ORs of the -11377C>G GG genotype were 2.4, 4, and 1.34 for the case-control groups less than 45 yr old (composed of 91 cases and 91 controls), 45-54 yr old (98 cases and 100 controls), and greater than 55 yr of age (83 cases and 68 controls), respectively, in the case of the G3 group.
- Haplotype and diplotype odds ratios for two or three SNPs
- As shown in Table 5, the GT haplotype composed of the risk alleles of both SNPs -11377C>G and +45T>G significantly increased the risk of obesity in the G3 group (OR, 1.65; 95% CI, 1.17-2.32). Although the OR for the GG haplotype was significantly high (OR=4.02), the number of subjects was not sufficient. In Model 2, the CT and GG haplotypes consisted of one risky allele of either -11377C>G or +276G>T that significantly increased the risk of obesity (i.e. OR, 2.87 and 3, respectively, in the G1 group), whereas the GT haplotype consisted of two risky alleles that moderately increased the risk of obesity only in the G3 group (OR, 1.52; 95% CI, 1.03-2.25). In Model 3, the risk of obesity among those with the GTG haplotype was three-fold higher compared to the reference group in G1, whereas it decreased to 1.87 (1.20-2.91) in the G3 group. With two and three markers there were three and seven marker combinations, respectively (i.e. 2n-1) for which a haplotype-based test could be carried out. Even without considering the LD between the markers, the multiple comparison levels of significance for haplotypes consisting of two and three SNPs were 0.017 and 7×10⁻³, respectively. The GT (p=0.004), GG (p=0.006) and GTG haplotypes (p=0.005) in each model for the G3 group were significant even after the Bonferroni correction. The GG haplotype in Model 2 also yielded a Bonferroni level of significance in both G1 (p=0.003) and G2 groups (p=0.013).
- The increased risk as the number of risky alleles increased in diplotypes of two SNPs, -11377C>G and +45T>G (i.e. OR, 2.96, 3.54, and 5.20 for CG/CT, CT/GT, and GT/GT, respectively), confirmed the contributions of the G and T alleles of each SNP in predisposing toward obesity (table not shown). This result also showed that the mutant alleles of two SNPs, -11377C>G and +276G>T, increased the risk of obesity whereas the G allele of +45T>G was protective.
RESULTS
- In the present study, three SNPs located on the ADIPOQ gene, which have previously been studied for an association with obesity in other ethnic groups [16], were evaluated in healthy Koreans. The C, T, and G alleles were the major alleles at SNPs -11377C>G, +45T>G, and +276G>T, respectively, as shown in other studies, including non-diabetic Japanese and non-diabetic Koreans [7,17]. A common allele, C, of -11377C>G was strongly associated with a lower plasma adiponectin level, a higher BMI, or T2D in some studies [18,19], whereas a rare allele, G, was associated with the same phenotypes in other studies [10,20]. Similar trends toward inconsistent results across studies were observed for the +45T>G and +276G>T loci. The rare G allele at the +45T>G locus significantly increased the risk of obesity in non-diabetic Germans and in Japanese with T2D [7,8], while Loos et al. [21] recently reported that carriers of the rare GG homozygote showed a leaner phenotype than carriers of the common T allele. The G allele at the +276G>T locus was associated with lower plasma adiponectin concentrations and higher insulin resistance only in subjects with a high BMI (≥26.7) in non-diabetic Korean and Japanese populations [7,17]. Homozygotes for the haplotype T45-G276 had a higher body weight and waist circumference and lower plasma adiponectin concentrations in non-diabetic Italians and non-diabetic obese Koreans [17,22,23].
- In our study, the G allele of SNP -11377C>G (OR, 1.48; 95% CI, 1.13-1.94) and the T allele at the +45T>G locus were identified as being risk alleles for obesity, even after issues of study power and multiple testing were taken into account, where obesity was defined using both a higher BMI and a lower adiponectin concentration compared to the reference group. The T allele of the +276G>T locus was not statistically significant, but it increased the risk of obesity. Possible explanations for these inconsistent results across the studies include not only differences in population characteristics (e.g. demographic, genetic, and environmental factors, diagnostic criteria, etc.) but also the possibility that the configurations of genotypes or hapolotypes were mixed up in some studies. Minor allele frequencies of each SNP were different even from Japanese HapMap data (e.g. 28.9% of Japanese HapMap data vs. 24% of data in the current study for the SNP -11377C>G). Therefore, more prospective studies of a better design are necessary to confirm the effects of each variant on the development of obesity [17,24]. As shown in other Korean studies, linkage disequilibrium was not observed between SNPs -11377C>G, +45T>G or +276G>T, whereas two SNPs, +45T>G and +276G>T were in imperfect (r2=0.14) but complete linkage disequilibrium (D'=1) in our study [18,23].
- Overall, a stricter definition of the phenotype increased the statistical power to detect evidence of an association in our study. Although significantly high ORs were observed in the CG haplotype of -11377G>C and +45T>G (OR, 4.02) and the GGT haplotype (OR, 11.52), these high ORs may have been the result of the relatively small sample size (Table 4). Our results replicated the reverse relationship between BMI and plasma adiponectin (Table 3) and the association between ADIPOQ gene variants and obesity previously reported, although this study did not describe a causal relationship, but associations (Tables 4, 5) [5,10].
- Several potential limitations of our study should be mentioned. Firstly, BMI may not be a sufficient indicator for measuring the degree of obesity. Although regional differences in body fat affect the risk of metabolic abnormalities, and although ADIPOQ gene variants were suggested as modulating visceral fat accumulation in some studies, other studies detected no association between ADIPOQ gene variants and BMI [20]. Thus, other measurements of obesity such as the waist:hip ratio or waist circumference [10,25] might be better measures of abdominal obesity in the Korean population. Secondly, there may also be some interactions with other genes related to susceptibility to obesity. For instance, evidence for an interaction between SNPs in the promoters of ADIPOQ (-3971A>G) and ADIPOR1 (-3882T>C) was found [21]. Thirdly, the effects of environmental factors controlling the risk of obesity could not be evaluated in this study. Given the role of adiponectin in fatty acid oxidation, a reduction in plasma adiponectin levels may impact the ability to clear cellular adipose in obese individuals with an at-risk diplotype [20]. However, the effect of this risky polymorphism could be validly evaluated after controlling for environmental factors (e.g. physical activity, fried food intake, alcohol consumption, etc.), clinical characteristics (e.g. serum C-reactive protein, total cholesterol HDL ratio, blood pressure, etc.), and ethnicity [22,26]. Finally, the positive associations found in this study were based on the comparison made between a group of high BMI and low adiponectin subjects versus a group of low BMI and high adiponectin subjects. Thus, the statistical evidence might not reflect the effect of ADIPOQ gene variants on BMI and plasma adiponectin concentrations separately, but rather a joint consideration of both indices for obesity. Therefore, additional studies warrant validation of the relationship between the ADIPOQ gene and obesity identified in this study.
- In conclusion, the SNPs identified here (i.e. -11377C>G and +45T>G) may assist in identifying subjects who are at a greater risk of obesity among healthy Koreans. Such information may provide a chance for susceptible individuals to prevent obesity and for obese individuals to determine a more efficient means of weight control. Furthermore, understanding the mechanisms by which obesity could be controlled would make it possible for us to better understand the metabolic complications of obesity.
DISCUSSION
ACKNOWLEDGEMENTS
ACKNOWLEDGEMENTS
-
The authors have no conflicts of interest to declare for this study.
-
This article is available from: http://e-epih.org/.
NOTES
- 1. World Health Organization (WHO). Obesity: preventing and managing the global epidemic: report of a WHO consultation on obesity. 1998. Geneva: WHO.
- 2. Bassett J. International Diabetes Institute. World Health Organization, Regional Office for the Western Pacific. International Association for the Study of Obesity. International Obesity Task Force. The Asia-Pacific perspective: redefining obesity and its treatment. 2000. Sydney: Health Communications Australia.
- 3. Kim DM, Ahn CW, Nam SY. Prevalence of obesity in Korea. Obes Rev 2005;6:117-121. 15836462.ArticlePubMed
- 4. Yamauchi T, Kamon J, Waki H, Terauchi Y, Kubota N, Hara K, et al. The fat-derived hormone adiponectin reverses insulin resistance associated with both lipoatrophy and obesity. Nat Med 2001;7:941-946. 11479627.ArticlePubMed
- 5. Yang WS, Lee WJ, Funahashi T, Tanaka S, Matsuzawa Y, Chao CL, et al. Plasma adiponectin levels in overweight and obese Asians. Obes Res 2002;10:1104-1110. 12429873.ArticlePubMed
- 6. Takahashi M, Arita Y, Yamagata K, Matsukawa Y, Okutomi K, Horie M, et al. Genomic structure and mutations in adipose-specific gene, adiponectin. Int J Obes Relat Metab Disord 2000;24:861-868. 10918532.ArticlePubMed
- 7. Hara K, Boutin P, Mori Y, Tobe K, Dina C, Yasuda K, et al. Genetic variation in the gene encoding adiponectin is associated with an increased risk of type 2 diabetes in the Japanese population. Diabetes 2002;51:536-540. 11812766.ArticlePubMed
- 8. Stumvoll M, Tschritter O, Fritsche A, Staiger H, Renn W, Weisser M, et al. Association of the T-G polymorphism in adiponectin (exon 2) with obesity and insulin sensitivity: interaction with family history of type 2 diabetes. Diabetes 2002;51:37-41. 11756320.ArticlePubMed
- 9. Filippi E, Sentinelli F, Trischitta V, Romeo S, Arca M, Leonetti F, et al. Association of the human adiponectin gene and insulin resistance. Eur J Hum Genet 2004;12:199-205. 14673476.ArticlePubMed
- 10. Tankó LB, Siddiq A, Lecoeur C, Larsen PJ, Christiansen C, Walley A, et al. ACDC/adiponectin and PPAR-gamma gene polymorphisms: implications for features of obesity. Obes Res 2005;13:2113-2121. 16421345.ArticlePubMed
- 11. Yang WS, Chuang LM. Human genetics of adiponectin in the metabolic syndrome. J Mol Med 2006;84:112-121. 16389553.ArticlePubMed
- 12. Grant DM, Phillips MS. In: Kalow W, Meyer UA, Tyndale R, eds. Technologies for the analysis of single nucleotide polymorphisms: an overview. Pharmacogenomics. 2001. New York: Marcel Dekker; p 183-190.Article
- 13. Kyriakou T, Collins LJ, Spencer-Jones NJ, Malcolm C, Wang X, Snieder H, et al. Adiponectin gene ADIPOQ SNP associations with serum adiponectin in two female populations and effects of SNPs on promoter activity. J Hum Genet 2008;53:718-727. 18523726.ArticlePubMedPMC
- 14. Barrett JC, Fry B, Maller J, Daly MJ. Haploview: analysis and visualization of LD and haplotype maps. Bioinformatics 2005;21:263-265. 15297300.ArticlePubMed
- 15. Purcell S, Cherny SS, Sham PC. Genetic Power Calculator: design of linkage and association genetic mapping studies of complex traits. Bioinformatics 2003;19:149-150. 12499305.ArticlePubMed
- 16. Ukkola O, Ravussin E, Jacobson P, Sjöström L, Bouchard C. Mutations in the adiponectin gene in lean and obese subjects from the Swedish obese subjects cohort. Metabolism 2003;52:881-884. 12870165.ArticlePubMed
- 17. Jang Y, Lee JH, Chae JS, Kim OY, Koh SJ, Kim JY, et al. Association of the 276G->T polymorphism of the adiponectin gene with cardiovascular disease risk factors in nondiabetic Koreans. Am J Clin Nutr 2005;82:760-767. 16210704.ArticlePubMed
- 18. Gu HF, Abulaiti A, Ostenson CG, Humphreys K, Wahlestedt C, Brookes AJ, et al. Single nucleotide polymorphisms in the proximal promoter region of the adiponectin (APM1) gene are associated with type 2 diabetes in Swedish caucasians. Diabetes 2004;53:S31-S35. 14749263.ArticlePubMed
- 19. Bouatia-Naji N, Meyre D, Lobbens S, Séron K, Fumeron F, Balkau B, et al. ACDC/adiponectin polymorphisms are associated with severe childhood and adult obesity. Diabetes 2006;55:545-550. 16443793.ArticlePubMed
- 20. Vasseur F, Helbecque N, Lobbens S, Vasseur-Delannoy V, Dina C, Clément K, et al. Hypoadiponectinaemia and high risk of type 2 diabetes are associated with adiponectin-encoding (ACDC) gene promoter variants in morbid obesity: evidence for a role of ACDC in diabesity. Diabetologia 2005;48:892-899. 15830179.ArticlePubMed
- 21. Loos RJ, Ruchat S, Rankinen T, Tremblay A, Pérusse L, Bouchard C. Adiponectin and adiponectin receptor gene variants in relation to resting metabolic rate, respiratory quotient, and adiposity-related phenotypes in the Quebec Family Study. Am J Clin Nutr 2007;85:26-34. 17209173.ArticlePubMed
- 22. Menzaghi C, Ercolino T, Di Paola R, Berg AH, Warram JH, Scherer PE, et al. A haplotype at the adiponectin locus is associated with obesity and other features of the insulin resistance syndrome. Diabetes 2002;51:2306-2312. 12086965.ArticlePubMed
- 23. Shin MJ, Jang Y, Koh SJ, Chae JS, Kim OY, Lee JE, et al. The association of SNP276G>T at adiponectin gene with circulating adiponectin and insulin resistance in response to mild weight loss. Int J Obes (Lond) 2006;30:1702-1708. 16607383.ArticlePubMed
- 24. Jang Y, Lee JH, Kim OY, Koh SJ, Chae JS, Woo JH, et al. The SNP276G>T polymorphism in the adiponectin (ACDC) gene is more strongly associated with insulin resistance and cardiovascular disease risk than SNP45T>G in nonobese/nondiabetic Korean men independent of abdominal adiposity and circulating plasma adiponectin. Metabolism 2006;55:59-66. 16324920.ArticlePubMed
- 25. The IDF consensus worldwide definition of the metabolic syndrome. International Diabetes Federation. cited 2007 Sep 2. Available from: http://www.idf.org/webdata/docs/Metabolic_syndrome_definition.pdf.
- 26. Yang WS, Tsou PL, Lee WJ, Tseng DL, Chen CL, Peng CC, et al. Allele-specific differential expression of a common adiponectin gene polymorphism related to obesity. J Mol Med 2003;81:428-434. 12750819.ArticlePubMed
REFERENCES
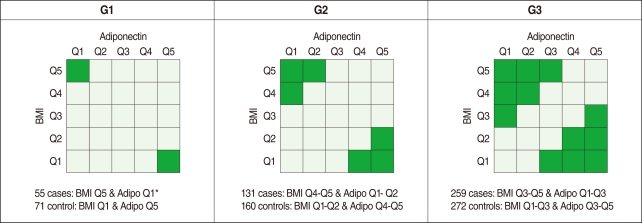
Figure & Data
References
Citations
- Association study between adiponectin gene variants, serum levels and the risk of type 2 diabetes in Tunisian women: Insights from BMI stratification
Sameh Sarray, Intissar Ezzidi, Saif Moussa, Hassen Ben Abdennebi, Nabil Mtiraoui
Cytokine.2024; 181: 156695. CrossRef - Risk variants of obesity associated genes demonstrate BMI raising effect in a large cohort
Muhammad Saqlain, Madiha Khalid, Muhammad Fiaz, Sadia Saeed, Asad Mehmood Raja, Muhammad Mobeen Zafar, Tahzeeb Fatima, João Bosco Pesquero, Cristina Maglio, Hadi Valadi, Muhammad Nawaz, Ghazala Kaukab Raja, Nidaa Ababneh
PLOS ONE.2022; 17(9): e0274904. CrossRef - Association of the ADIPOQ-AS LncRNA polymorphism rs2241766 with obesity: A Meta-analysis
M.N. Ammar, L. Lipovich, R.M. Ali, M.A. Amelina, T.P. Shkurat
Human Gene.2022; 34: 201114. CrossRef - Common Variants in Lipid Metabolism–Related Genes Associate with Fat Mass Changes in Response to Dietary Monounsaturated Fatty Acids in Adults with Abdominal Obesity
Shatha S Hammad, Peter Eck, Jyoti Sihag, Xiang Chen, Philip W Connelly, Benoît Lamarche, Patrick Couture, Valérie Guay, Julie Maltais-Giguère, Sheila G West, Penny M Kris-Etherton, Kate J Bowen, David J A Jenkins, Carla G Taylor, Danielle Perera, Angela W
The Journal of Nutrition.2019; 149(10): 1749. CrossRef - Associations between polymorphisms of the ADIPOQ gene and hypertension risk: a systematic and meta-analysis
Weina Fan, Xiaowei Qu, Jing Li, Xingning Wang, Yanping Bai, Qingmei Cao, Liqun Ma, Xiaoyao Zhou, Wei Zhu, Wei Liu, Qiang Ma
Scientific Reports.2017;[Epub] CrossRef - An Updated Systematic Review and Meta-analysis of Association Between Adiponectin Gene Polymorphisms and Coronary Artery Disease
Haifeng Hou, Siqi Ge, Linlin Zhao, Chenglin Wang, Wei Wang, Xuezhen Zhao, Zheng Sun
OMICS: A Journal of Integrative Biology.2017; 21(6): 340. CrossRef - Change in Weight and Body Mass Index Associated With All-Cause Mortality in Korea: A Nationwide Longitudinal Study
Yang-Hyun Kim, Seon Mee Kim, Kyung-do Han, Jang-Won Son, Seong-Su Lee, Sang Woo Oh, Won-Young Lee, Soon Jib Yoo
The Journal of Clinical Endocrinology & Metabolism.2017; 102(11): 4041. CrossRef - A Validation Study of Adiponectin rs266729 Gene Variant with Type 2 Diabetes, Obesity, and Metabolic Phenotypes in a Taiwanese Population
Tun-Jen Hsiao, Eugene Lin
Biochemical Genetics.2016; 54(6): 830. CrossRef - ADIPOQ and IL6 variants are associated with a pro-inflammatory status in obeses with cardiometabolic dysfunction
Raquel de Oliveira, Tamiris Invencioni Moraes, Alvaro Cerda, Mario Hiroyuki Hirata, Cristina Moreno Fajardo, Marcela Correia Sousa, Egidio Lima Dorea, Márcia Martins Silveira Bernik, Rosario Dominguez Crespo Hirata
Diabetology & Metabolic Syndrome.2015;[Epub] CrossRef - Metabolic abnormalities in young Egyptian women with polycystic ovary syndrome and their relation to ADIPOQ gene variants and body fat phenotype
Moushira Zaki, Shams Kholoussi, Somaia Ismail, Haiam Abdel Raouf, Iman Helwa, Naglaa Hassan, Eman Youness, Nadia A. Mohamed, Sanaa Kamal, Walaa Yousef, Mohamed Shaker, Wafaa Ezzat, Yasser A. Elhosary, Omnia M. Saleh, Mona El Gammal, HalaT. El-Bassyouni, S
Egyptian Journal of Medical Human Genetics.2015; 16(4): 367. CrossRef - Gender-specific associations between ADIPOQ gene polymorphisms and adiponectin levels and obesity in the Jackson Heart Study cohort
Pia Riestra, Samson Y. Gebreab, Ruihua Xu, Rumana J. Khan, Aurelian Bidulescu, Adolfo Correa, Fasil Tekola-Ayele, Sharon K. Davis
BMC Medical Genetics.2015;[Epub] CrossRef - Association of ADIPOQ polymorphisms with obesity risk: A meta-analysis
Jie-fu Lu, You Zhou, Gui-hua Huang, Hai-xing Jiang, Bang-li Hu, Shan-yu Qin
Human Immunology.2014; 75(10): 1062. CrossRef - Polymorphisms of the adiponectin gene in gestational hypertension and pre-eclampsia
J S R Machado, A C T Palei, L M Amaral, A C Bueno, S R Antonini, G Duarte, J E Tanus-Santos, V C Sandrim, R C Cavalli
Journal of Human Hypertension.2014; 28(2): 128. CrossRef - Effect of the ADIPOQ Gene -11391G/A Polymorphism Is Modulated by Lifestyle Factors in Mexican Subjects
Maritza Roxana Garcia-Garcia, María Antonieta Morales-Lanuza, Wendy Yareny Campos-Perez, Bertha Ruiz-Madrigal, Monserrat Maldonado-Gonzalez, Barbara Vizmanos, Ivan Hernandez-Cañaveral, Irinea Yañez-Sanchez, Sonia Roman, Arturo Panduro, Erika Martinez-Lope
Lifestyle Genomics.2014; 7(4-6): 212. CrossRef - Adiponectin gene polymorphisms may not be associated with idiopathic premature ovarian failure
Yuqin Ye, Danhua Pu, Jiayin Liu, Fanghong Li, Yugui Cui, Jie Wu
Gene.2013; 518(2): 262. CrossRef - Adiponectin Level and Gene Variability Are Obesity and Metabolic Syndrome Markers in a Young Population
Ivana Karmelić, Jasna Lovrić, Tamara Božina, Hana Ljubić, Željka Vogrinc, Nada Božina, Jadranka Sertić
Archives of Medical Research.2012; 43(2): 145. CrossRef - Single-nucleotide polymorphisms and haplotypes in the adiponectin gene contribute to the genetic risk for type 2 diabetes in Tunisian Arabs
Nabil Mtiraoui, Intissar Ezzidi, Amira Turki, Arbi Chaieb, Touhami Mahjoub, Wassim Y. Almawi
Diabetes Research and Clinical Practice.2012; 97(2): 290. CrossRef - Associations of adiponectin gene polymorphisms with polycystic ovary syndrome: a meta-analysis
Hongxia Jia, Lili Yu, Xuxiao Guo, Wei Gao, Zhaoshun Jiang
Endocrine.2012; 42(2): 299. CrossRef
 PubReader
 ePub Link
 Cite
Cite

