Articles
- Page Path
- HOME > Epidemiol Health > Volume 46; 2024 > Article
-
Original Article
Predictive ability of the Chinese visceral adiposity index for incident hypertension in working-aged Koreans -
Ju Young Jung1
 , Chang-Mo Oh2, Hyun chul Jo3, Sung Keun Park1,4
 -
Epidemiol Health 2024;46:e2024034.
DOI: https://doi.org/10.4178/epih.e2024034
Published online: February 27, 2024
1Total Healthcare Center, Kangbuk Samsung Hospital, Sungkyunkwan University School of Medicine, Seoul, Korea
2Departments of Preventive Medicine, Kyung Hee University School of Medicine, Seoul, Korea
3Departments of Internal Medicine, Jo Hyun Chul Private Clinic, Gimpo, Korea
4Center for Cohort Studies, Kangbuk Samsung Hospital, Sungkyunkwan University School of Medicine, Seoul, Korea
- Correspondence: Sung Keun Park Total Healthcare Center, Kangbuk Samsung Hospital, Sungkyunkwan University School of Medicine, 67 Sejong-daero, Jung-gu, Seoul 04514, Korea E-mail: kkkmin7@naver.com
© 2024, Korean Society of Epidemiology
This is an open-access article distributed under the terms of the Creative Commons Attribution License (http://creativecommons.org/licenses/by/4.0/), which permits unrestricted use, distribution, and reproduction in any medium, provided the original work is properly cited.
Abstract
-
OBJECTIVES
- The Chinese visceral adiposity index (CVAI) was developed to assess visceral adipose tissue in the Asian population. This study evaluated the predictive ability of the CVAI for incident hypertension in Korean adults.
-
METHODS
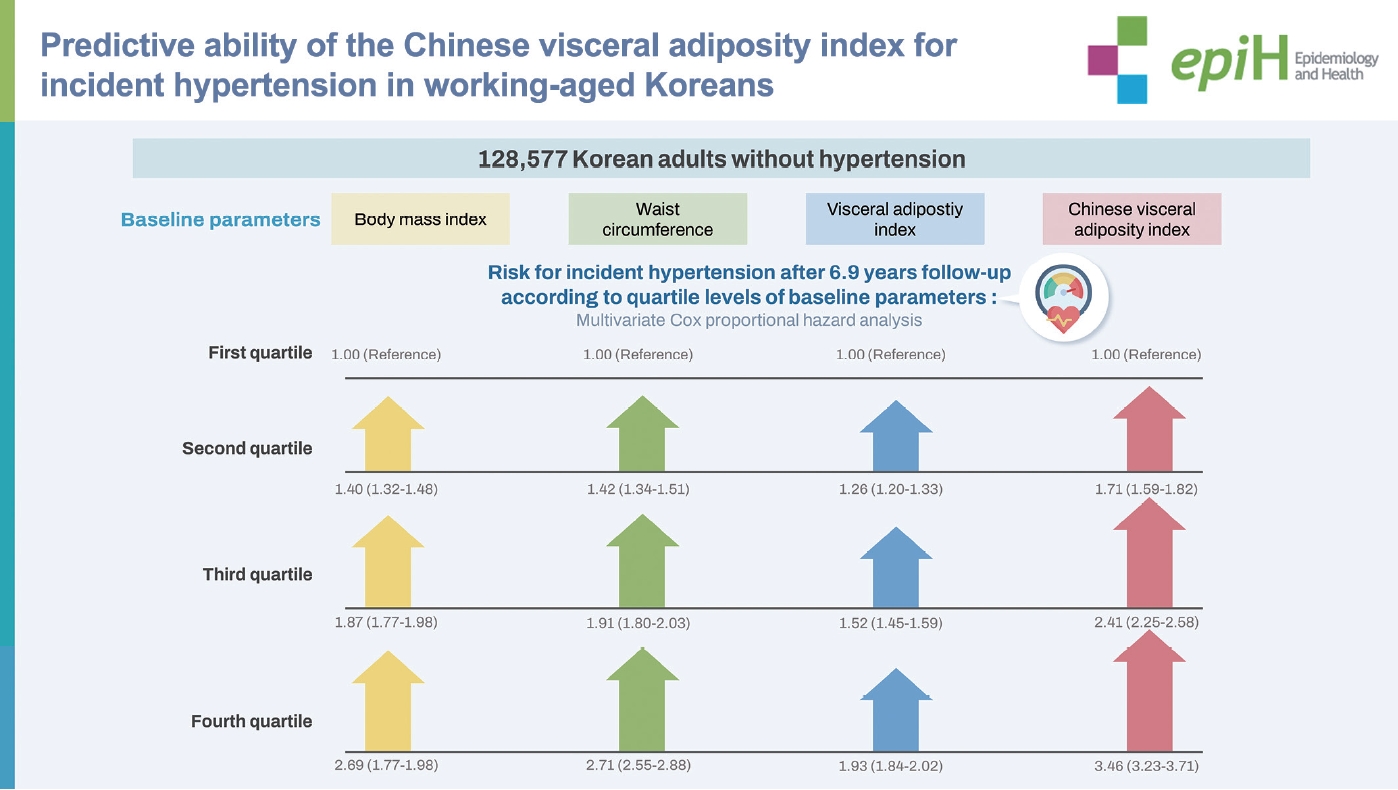
- The study participants included 128,577 Koreans without hypertension. They were grouped in quartiles according to body mass index (BMI), waist circumference (WC), visceral adipose index (VAI), and CVAI values. The Cox proportional hazard assumption was used to evaluate the hazard ratio (HR) and 95% confidence interval (CI) for incident hypertension (adjusted HR [95% CI]) according to quartile level across a follow-up period of 6.9 years. Subgroup analyses were conducted by gender and obesity. The area under the curve was calculated to compare the predictive abilities of all indices (BMI, WC, VAI, and CVAI) for incident hypertension.
-
RESULTS
- The CVAI was proportionally associated with the risk of hypertension in all participants (quartile 1: reference; quartile 2: 1.71 [95% CI, 1.59 to 1.82]; quartile 3: 2.41 [95% CI, 2.25 to 2.58]; and quartile 4: 3.46 [95% CI, 3.23 to 3.71]). Time dependent receiver operating characteristic curve analysis indicated that the CVAI was superior to BMI, WC, and VAI in predicting hypertension at the 2-year, 4-year, 6-year, and 8-year follow-ups. This finding was also observed in the gender and obesity subgroups. The predictive ability of the CVAI was greater in the women and non-obese subgroups than in the men and obese subgroups.
-
CONCLUSIONS
- The CVAI was a stronger predictor of hypertension than BMI, WC, and VAI.
- Hypertension is a leading risk factor for cardiovascular disease. It is known that visceral adiposity has an important role in the pathogenesis of hypertension in obesity. Recent studies have demonstrated that Chinese visceral adiposity index (CVAI) is more discriminative the high risk group for cardiovascular disease in Asians than other obesity indices. We compared the predictive ability for the development hypertension among body mass index, waist circumference, visceral adiposity index, and CVAI. Our study showed that CVAI is superior to predict hypertension than other indices.
Key Message
- Hypertension is a leading preventable risk factor for cardiovascular (CV) disease and all-cause mortality worldwide [1,2]. Despite improvements in the therapeutic approach to hypertension in recent decades, a significant number of hypertensive patients are still poorly controlled [3]. Thus, to prevent hypertension and reduce the disease burden, it is imperative to use accurate and applicable clinical indices to distinguish high-risk groups.
- The relationship between obesity and hypertension is well established. A meta-analysis showed a 1-fold to 2-fold increased risk of incident hypertension with increases in obesity indices including body mass index (BMI), waist circumference (WC), waist‐to‐hip ratio, and waist‐to‐height ratio [4]. In particular, abdominal obesity (i.e., abdominal fat deposition) was found to be an important risk factor for cardiometabolic diseases including hypertension. It has been demonstrated that abdominal obesity is more often associated with CV risk than general obesity in adults [5,6].
- Visceral adipose tissue (VAT) is a major factor mediating the association between abdominal obesity and increased CV risk. Previous studies have indicated that visceral fat is more closely linked to the development of hypertension than subcutaneous fat [7,8], raising interest in VAT as a reliable predictor of hypertension. The visceral adiposity index (VAI) is a mathematical model that allows inexpensive and precise assessment of visceral adiposity by clinical and anthropometric measurements [9]. Cross-sectional studies have demonstrated that the VAI is significantly associated with hypertension among Caucasians [10,11]. However, the VAI may have drawbacks when assessing body fat distribution in Asians because it was designed for Caucasians.
- The Chinese visceral adiposity index (CVAI) was developed for Chinese adults using demographic, anthropometric, and metabolic characteristics [12]. Studies have suggested that the CVAI is superior to the VAI and other classic indices for obesity in predicting cardiometabolic disease including diabetes mellitus (DM) [13,14] and atherosclerotic diseases [15,16] among Chinese and Japanese populations. In addition, the CVAI has been significantly associated with the risk of hypertension in both cross-sectional [17] and prospective studies [18] of middle-aged Chinese. However, there is still insufficient data to confirm the association between the CVAI and the risk of hypertension in Asians. Furthermore, published studies have been conducted among Chinese populations only.
- To validate the predictive ability of the CVAI for hypertension in Asians other than Chinese, we evaluated the risk of incident hypertension according to the CVAI quartile levels in 128,577 Koreans. In addition, we compared the CVAI, BMI, WC, and VAI as predictors of hypertension to identify any comparative advantage of the CVAI.
INTRODUCTION
- Study participants and exclusion criteria
- Relevant clinical and socio-demographic data were obtained from the Kangbuk Samsung Health Study (KSHS). The KSHS is a cohort study to investigate the medical data of Koreans who have received medical health check-ups in Kangbuk Samsung Hospital. Korea’s Industrial Safety and Health law requires that all Korean employees receive a medical health check-up annually or biennially. We initially enrolled 221,954 adults aged 18 years to 87 years who underwent medical check-ups between March 2011 and December 2012. From this sample, 65,211 participants were excluded for the following reasons: 852 participants were missing values for age, BMI, WC, triglyceride (TG), and high density lipoprotein-cholesterol (HDL-C) levels required to assess the VAI and CVAI; 36,167 participants were missing values for clinical parameters (e.g., fasting glucose, history of hypertension, homeostatic model assessment for insulin resistance [HOMA-IR]); 3,850 participants were taking medication for dyslipidemia; 5,778 participants had a history of major diseases including cancer, stroke, and coronary artery disease; and 18,564 participants had a history of baseline hypertension. Of the remaining 156,743 participants, we finally included the 128,577 participants who had revisited the hospital to receive health check-ups between January 2013 and December 2019.
- Clinical, anthropometric, and biochemical data
- Past medical history and health-related behaviors were confirmed through a self-administered questionnaire, and anthropometric measurements such as weight, WC, and height, as well as biochemical tests including a lipid profile and fasting glucose were performed on all participants. Smoking patterns were divided into 3 categories: never, former, and current smoker. Alcohol consumption and frequency were assessed by the self-administered questionnaire. All participants were asked to answer questions about their average drinking frequency (day/wk or day/mo) and amount (grams). The average frequency and amount of alcohol intake was converted into daily alcohol use (g/day). The degree of physical activity was evaluated by the Korean-validated version of the International Physical Activity Questionnaire (IPAQ) short form and classified into 3 categories (low, moderate, and high) according to the guidelines prescribed by the IPAQ core group (http://www.ipaq.ki.se). Hypertension was defined as a prior diagnosis of hypertension or having a measured blood pressure (BP) ≥ 140/90 mmHg at initial and follow-up examinations. The cut-off point for hypertension was based on the Korean Hypertension Society guidelines [19]. Each BP was measured 3 times in a sitting position after a 5-minute rest by a trained nurse using an automated device with an interval of at least 30 seconds (53000- E2; Welch Allyn, Skaneateles Falls, NY, USA). Final BP levels were an average of the second and third BP measurements. The BMI was calculated by dividing weight (kg) by the square of the height (m2). Obesity was defined as a BMI ≥ 25 kg/m2 according to the International Obesity Task Force recommendation [20]. WC was measured at the narrowest point between the lower border of the rib cage and the iliac crest during minimal respiration in an erect position. DM was defined as one of following conditions: fasting glucose ≥ 126 mg/dL, glycated hemoglobin (HbA1c) ≥ 6.5%, or a prior diagnosis of DM [21].
- Blood samples were collected after > 12 hours of fasting and were drawn from an antecubital vein. The fasting serum glucose was measured by the hexokinase method, and the HbA1c was measured by immunoturbidimetric assay with a Cobra Integra 800 automatic analyzer (Roche Diagnostics, Basel, Switzerland).
- The enzymatic colorimetric test was used to measure total cholesterol and TG levels. Low-density lipoprotein cholesterol (LDL-C) and HDL-C were measured using the homogeneous enzymatic colorimetric test and the selective inhibition method, respectively (Advia 1650 Autoanalyzer; Bayer Diagnostics, Leverkusen, Germany). The VAI was calculated using the following equations [9]:
- The CVAI was calculated using the following equations [12]:
- Detailed descriptions of the study population and data collection are included in a previous study by our group [22].
- Statistical analysis
- To analyze baseline clinical characteristics, all participants were divided into 4 categories based on CVAI quartile levels. The baseline parameters of the groups are presented as means± standard deviations for continuous variables and as proportions for categorical variables. We compared variable differences among the 4 groups, using analysis of variance for continuous variables and the chi-square test for categorical variables.
- A Cox proportional hazard assumption was used to calculate the unadjusted and multivariable-adjusted hazard ratio (HR) and 95% confidence interval (CI) for hypertension. The multivariable adjusted HR (95% CI) was calculated for the quartile groups of BMI, WC, VAI, and CVAI. The adjusting covariates were the major risk factors of hypertension (model 1: age, gender, physical activity, alcohol intake, smoking, and DM), and the indicators of insulin resistance and chronic inflammation (model 2: model 1 plus HOMA-IR and c-reactive protein [CRP]). The incidence of cases, the incidence density (incident cases per 1,000 person-years [PYs]), and the PYs of each group were calculated. The proportional hazards assumption was confirmed by log-log plots and the Schoenfeld residual test. To verify multicollinearity between variables, we used variance inflation factor (VIF) analysis, which confirmed that there were no variables with a VIF >10. Subgroup analysis was performed according to gender and the presence or absence of obesity. Obesity subgroups were determined by a BMI ≥ 25 kg/m2 (obese subgroup) or a BMI < 25 kg/m2 (non-obese subgroup).
- Time dependent receiver operator characteristic (ROC) analysis was performed to compare the abilities of BMI, WC, VAI, and CVAI to predict the development of hypertension across the follow-up period. Because the maximum follow-up period was 8.8 years, the area under the ROC curve (AUC) and 95% CI were calculated based on the incidence of hypertension at 2 years, 4 years, 6 years, and 8 years. BMI, WC, VAI, and CVAI were treated as continuous variables. A p-value was also calculated in each time dependent AUC (reference: BMI). The time dependent ROC analysis was calculated using the TimeROC package (Comprehensive R Archive Network [CRAN], R Foundation for Statistical Computing, Vienna, Austria). Since time dependent ROC analysis required a significant amount of computing power and memory, 10% of the subjects were randomly selected from the total and from each subgroup (men, women, obese, and non-obese) and included in the time dependent ROC analysis.
- All statistical analyses were performed using R version 4.1.3 (R Foundation for Statistical Computing), and a value of p< 0.05 (2-sided) indicated statistical significance in all analyses.
- Ethics statement
- Ethics approval for the study protocol and analysis of the data were obtained from the Institutional Review Board (IRB) of Kangbuk Samsung Hospital (IRB No. KBSMC 2022-08-041). The IRB of Kangbuk Samsung Hospital waived informed consent for the study because only retrospective data was assessed, and all personal information was anonymized.
MATERIALS AND METHODS
- Baseline clinical characteristics of the study participants according to CVAI quartile are described in Table 1. Our study participants were working-aged adults with an average age of 38.4± 6.5 years, and a majority were men (58.6%). The proportion of men was only 14.8% in quartile 1, but reached 93.3% in quartile 4. The proportion of men, ages, BPs, TG levels, HOMA-IR levels, average alcohol consumption, and current smokers, as well as the prevalence of DM all increased with each subsequent quartile level of the CVAI. During the 6.9-year median follow-up period, 18,503 cases of hypertension (14.4%) were newly diagnosed among 128,577 study participants. The incidence of hypertension also increased with the quartile levels of the CVAI.
- The multivariable adjusted HR (95% CI) for hypertension revealed the proportional relationship between the CVAI quartile levels and the risk of hypertension among all study participants (quartile 1: reference; quartile 2: 1.71 [95% CI, 1.59 to 1.82]; quartile 3: 2.41 [95% CI, 2.25 to 2.58]; and quartile 4: 3.46 [95% CI, 3.23 to 3.71]) (Table 2). An identical relationship pattern was observed in the analysis for BMI, WC, and VAI. While the CVAI showed the greatest HR for hypertension, the VAI showed the lowest HR (quartile 1: reference; quartile 2: 1.26 [95% CI, 1.20 to 1.33]; quartile 3: 1.52 [95% CI, 1.45 to 1.59]; and quartile 4: 1.93 [95% CI, 1.84 to 2.02]).
- Subgroup analysis was conducted by gender and obesity (BMI ≥ 25 kg/m2). In the subgroup analysis for gender (Table 3), the risk of hypertension was proportionally associated with the quartiles of BMI, WC, VAI, and CVAI in both men and women. The magnitude of the HR for hypertension was greatest in the CVAI, and lowest in the VAI for each quartile group. The HR for hypertension was higher for women than men in each quartile group of the CVAI. Obesity subgroup analysis showed that the quartile levels of WC, VAI, and CVAI were proportionally associated with the risk of hypertension in both the obese subgroup (BMI ≥ 25 kg/m2) and the non-obese subgroup (BMI < 25 kg/m2) (Table 4). The CVAI had a higher HR for hypertension in each quartile group than WC and VAI. The non-obese subgroup showed a higher HR for hypertension in each quartile group of the CVAI than the obese subgroup.
- The results of time dependent ROC analysis for BMI (reference), WC, VAI, and CVAI in relation to all participants, gender subgroups, and obesity subgroups is presented in Table 5. During the participant follow-ups (2, 4, 6, and 8 years), the CVAI showed higher levels in the AUC (95% CI) than BMI, whereas the VAI showed lower levels in the AUC (95% CI) than BMI. Similar findings were observed in the gender and obesity subgroups. In men, the AUC (95% CI) was higher in the CVAI than in BMI at the 4-year and 5-year follow-ups. In women, the AUC (95% CI) was consistently higher in the CVAI than in BMI across all follow-up times. In addition, women had a higher AUC (95% CI) for the CVAI than men across all follow-up times. In the obesity subgroups, the AUC (95% CI) for the CVAI was higher in the non-obese group than in the obese group across all follow-up times. The ROC curves determined by time dependent ROC analysis are shown in Supplementary Materials 1-5.
RESULTS
- The optimal index for assessing VAT remains debatable. It is known that anthropometric measurements are inherently limited in their ability to precisely measure VAT. Although the VAI has been used to predict VAT, its applicability in Asians is questionable. Thus, the CVAI was developed for the Chinese population to obtain a more precise assessment of VAT in Asians [12].
- The present study was a large scale cohort study to verify the predictive ability of the CVAI for incident hypertension among working-aged Korean adults. In this study, the CVAI quartile levels were proportionally associated with the risk of hypertension. An identical association was observed in the 4 subgroups (men, women, obese, and non-obese). In particular, the CVAI was a more reliable predictor of hypertension than BMI, WC, and the VAI. These results indicated that increases in the CVAI strongly predicted the development of hypertension, even in relatively young Korean adults. This suggests that the CVAI is a reliable tool for estimating VAT to predict hypertension in working-aged Koreans.
- Previous studies of middle-aged Chinese showed similar findings [17,18]. In a cross-sectional study of 34,732 Chinese [17], the CVAI was more significantly associated with hypertension (odds ratio, 3.475; 95% CI, 3.158 to 3.824) than other obesity indices such as the VAI, BMI, WC, and waist-to-height ratio. A stratified analysis showed that this association remained significant at any level of blood glucose, age, or estimated glomerular filtration rate. A prospective cohort study analyzed the relative risk (RR) of hypertension in relation to CVAI quartile levels in 10,304 Chinese with a median follow-up of 6.03 years [18]. In that study, the highest quartile group showed an increased RR for men (1.29; 95% CI, 1.05 to 1.59) and women (1.53; 95% CI, 1.22 to 1.91), when compared with the lowest quartile group. These studies support the potential of the CVAI as an early predictor of incident hypertension. However, although studies of middle-aged Chinese showed the predictive ability of the CVAI for the risk of hypertension, its generalizability and applicability to other Asians and younger age groups has not been well investigated. Our work expands the predictive ability of the CVAI for hypertension to other Asians and relatively young adults with our large sample size and comprehensive use of detailed variables. The CVAI may be a useful index to predict hypertension among young Asian adults and contribute to the prevention and early management of hypertension.
- Our subgroup analyses further supported the predictive ability of the CVAI for cardiometabolic risk factors including hypertension. In the subgroup analysis by gender, the predictive ability of the CVAI was relatively stronger in women than men. Similar features of the CVAI have been observed in previous Chinese studies that reported higher levels of odds ratio and RR in women [17,18]. Gender differences in fat deposition may be a reason for this finding. It has been reported that obesity is more likely to contribute to the elevation of BP in women than men [23]. In particular, VAT was more strongly associated with hypertension in women than men [24]. Asian women are more predisposed to abdominal fat deposition [25], which can lead to a higher risk of adverse metabolic outcomes [26]. Thus, it seems that the high predictability of the CVAI derived from its precise assessment of VAT is particularly relevant in women. An elevated CVAI in women should be cautiously regarded as a warning sign of CV risk, requiring a preventive approach. Our obesity subgroup analysis addressed the ability of the CVAI to predict hypertension based on the degree of obesity. The non-obese group consistently showed higher HR levels for hypertension in each CVAI quartile group than the obese group. In addition, the AUC of the CVAI for hypertension was higher in the non-obese group than the obese group. These findings suggested that the CVAI was more effective at predicting hypertension in the non-obese group than the obese group. Results of the obesity subgroup analysis conflict with the common notion that obese people would have a higher CVAI predictability due to their greater VAT. The metabolic characteristics of Asians may explain these results. A characteristic of obesity in Asians is a relatively higher adiposity. Asians have 3% to 5% higher total body fat when compared with white Europeans with the same BMI [27]. Moreover, studies have demonstrated that Asians tend to accumulate more visceral fat [28]. It is presumed that this feature of Asians contributes to the higher cardiometabolic risk of Asians with the same metabolic conditions. Therefore, many Asians may have a relatively high degree of VAT despite a normal or low BMI and are at increased risk of hypertension. In practice, individuals with high body fat despite a normal body weight are considered to be ‘normal weight obese’, which is a typical phenotype of obesity in Asians [29]. Studies have demonstrated that individuals with normal weight obesity have an increased cardiometabolic risk and premature mortality [30,31]. Therefore, to predict and manage CV risk in Asians, it is clinically important to evaluate VAT in apparently non-obese individuals. As a reliable index for distinguishing normal weight obesity, the CVAI can be an effective tool for predicting CV risk in Asians.
- Our analysis indicated that the CVAI was superior to BMI, WC, and the VAI in predicting hypertension. This finding has been consistently observed in other studies of Chinese adults. The plausible explanation for this finding may be the superiority of the CVAI in evaluating VAT among Asians. Studies have found that VAT is more strongly associated with incident hypertension than subcutaneous fat and other fat tissue [32,33]. Laboratory research has demonstrated that VAT is involved in the pathogenesis of hypertension through activation of sympathetic tone [34], elevated secretion of proinflammatory cytokines [33], disturbed vasodilation, and decreased natriuresis [35]. Therefore, it can be presumed that the predictability of indices for hypertension rely on the accuracy of VAT estimates. The CVAI more accurately estimates VAT than BMI, WC, and the VAI. BMI is unable to differentiate fat mass from lean mass and does not reflect fat distribution [36]. Although WC seems to be more precise in assessing central obesity than BMI, WC cannot distinguish subcutaneous fat from visceral fat. Iranian and Chinese studies found that the VAI was a weaker predictor of incident hypertension than other indices [37,38]. As an index reflecting both obesity and lipid levels, the CVAI was also significantly associated with VAT when assessed by computed tomography. When added to these reports, our results suggest the clinical usefulness of the CVAI in predicting cardiometabolic diseases related to VAT in Asians.
- The present study had several limitations. First, the study sample only included Korean adults. Therefore, our results may not be generalizable to Asians living in other regions such as South Asia and Southeast Asia. Further studies should be conducted to include people living in other Asian areas. Second, the follow-up period (6.9 years) was not long enough to reflect the long-term incidence of hypertension. A longer follow-up period may result in a higher incidence of hypertension, which might lead to a difference in the magnitude of association between the obesity indices and the risk of hypertension. Third, we acknowledge that we were unable to consider all factors affecting the incidence of hypertension. The development of hypertension is the outcome of a complex interaction of biological, hereditary, genetic, and environmental factors, thus it was impossible to address all risk factors.
- In conclusion, the CVAI was a reliable predictor of hypertension among working-aged Korean adults. In particular, the CVAI was superior to BMI, WC, and the VAI in predicting the development of hypertension. The predictive ability of the CVAI for hypertension was more prominent in women and non-obese individuals than in men and obese individuals, respectively. The CVAI can be used as a reliable and effective index for the early identification of Asians at high risk for hypertension.
DISCUSSION
Supplementary materials
-
Conflict of interest
The authors have no conflicts of interest to declare for this study.
-
Funding
None.
-
Author contributions
Conceptualization: Park SK. Data curation: Jung JY. Formal analysis: Jung JY, Oh CM. Funding acquisition: None. Methodology: Jung JY, Oh CM, Jo HC, Park SK. Project administration: Park SK. Visualization: Park SK. Writing – original draft: Jung JY. Writing – review & editing: Oh CM, Jo HC, Park SK.
NOTES
ACKNOWLEDGEMENTS

Values are presented as mean±standard deviation or number (%).
CVAI, Chinese visceral adiposity index; BP, blood pressure; HDL-C, high density lipoprotein-cholesterol; HOMA-IR, homeostatic model assessment for insulin resistance; CRP, c-reactive protein; BMI, body mass index; VAI, visceral adiposity index; PA, physical activity; DM, diabetes mellitus.
BMI, body mass index; VAI, visceral adiposity index; CVAI, Chinese visceral adiposity index; PY, person-year; HOMA-IR, homeostatic model assessment for insulin resistance; CRP, c-reactive protein.
1 Model 1: age, gender, physical activity, alcohol intake, smoking, diabetes mellitus; Model 2: Model 1+HOMA-IR, CRP.
BMI, body mass index; VAI, visceral adiposity index; CVAI, Chinese visceral adiposity index; PY, person-year; HOMA-IR, homeostatic model assessment for insulin resistance; CRP, c-reactive protein.
1 Model 1: age, physical activity, alcohol intake, smoking, total calorie intake; Model 2: Model 1+HOMA-IR, CRP.
BMI, body mass index; VAI, visceral adiposity index; CVAI, Chinese visceral adiposity index; PY, person-year; HOMA-IR, homeostatic model assessment for insulin resistance; CRP, c-reactive protein.
1 Model 1: age, gender, physical activity, alcohol intake, smoking, diabetes mellitus; Model 2: Model 1+HOMA-IR, CRP.
| Variables | BMI | WC | VAI | CVAI |
|---|---|---|---|---|
| All participants (yr) | ||||
| 2 | 0.695 (0.668, 0.722) | 0.700 (0.673, 0.727) | 0.614 (0.584, 0.646)*** | 0.718 (0.693, 0.744)** |
| 4 | 0.698 (0.680, 0.716) | 0.697 (0.680, 0.715) | 0.640 (0.620, 0.660)*** | 0.725 (0.708, 0.742)*** |
| 6 | 0.699 (0.683, 0.714) | 0.700 (0.685, 0.716) | 0.643 (0.626, 0.660)*** | 0.725 (0.710, 0.739)*** |
| 8 | 0.659 (0.639, 0.678) | 0.655 (0.635, 0.674) | 0.587 (0.567, 0.608)*** | 0.672 (0.653, 0.691)** |
| Men (yr) | ||||
| 2 | 0.630 (0.594, 0.666) | 0.629 (0.594, 0.665) | 0.604 (0.570, 0.638) | 0.642 (0.607, 0.676) |
| 4 | 0.641 (0.619, 0.664) | 0.644 (0.622, 0.666) | 0.625 (0.602, 0.647) | 0.663 (0.642, 0.684)*** |
| 6 | 0.644 (0.624, 0.663) | 0.643 (0.623, 0.662) | 0.622 (0.602, 0.642) | 0.662 (0.643, 0.681)** |
| 8 | 0.616 (0.592, 0.644) | 0.614 (0.589, 0.638) | 0.602 (0.578, 0.626) | 0.623 (0.599, 0.647) |
| Women (yr) | ||||
| 2 | 0.628 (0.523, 0.733) | 0.606 (0.512, 0.700) | 0.623 (0.517, 0.730) | 0.703 (0.617, 0.790)* |
| 4 | 0.662 (0.606, 0.717) | 0.642 (0.587, 0.697) | 0.665 (0.604, 0.726) | 0.727 (0.673, 0.781)*** |
| 6 | 0.672 (0.628, 0.715) | 0.660 (0.617, 0.703) | 0.671 (0.627, 0.715) | 0.724 (0.682, 0.766)*** |
| 8 | 0.630 (0.584, 0.676) | 0.614 (0.567, 0.660) | 0.584 (0.539, 0.629) | 0.655 (0.612, 0.699)* |
| Obese (yr) | ||||
| 2 | 0.583 (0.536, 0.629) | 0.605 (0.561, 0.649) | 0.535 (0.492, 0.579) | 0.631 (0.589, 0.674)* |
| 4 | 0.569 (0.539, 0.599) | 0.591 (0.562, 0.621) | 0.556 (0.526, 0.585) | 0.622 (0.594, 0.650)*** |
| 6 | 0.575 (0.548, 0.601) | 0.594 (0.568, 0.620) | 0.548 (0.522, 0.574) | 0.624 (0.599, 0.649)*** |
| 8 | 0.586 (0.551, 0.621) | 0.592 (0.557, 0.628) | 0.569 (0.534, 0.605) | 0.619 (0.584, 0.654)* |
| Non-obese (yr) | ||||
| 2 | 0.665 (0.623, 0.706) | 0.700 (0.661, 0.740)* | 0.642 (0.595, 0.688) | 0.742 (0.704, 0.779)*** |
| 4 | 0.682 (0.656, 0.708) | 0.679 (0.653, 0.704) | 0.618 (0.589, 0.647)*** | 0.716 (0.691, 0.741)*** |
| 6 | 0.672 (0.650, 0.694) | 0.666 (0.644, 0.688) | 0.618 (0.594, 0.642)*** | 0.701 (0.680, 0.723)*** |
| 8 | 0.620 (0.594, 0.645) | 0.625 (0.600, 0.650) | 0.560 (0.534, 0.587)*** | 0.657 (0.632, 0.681)*** |
- 1. Kontis V, Mathers CD, Bonita R, Stevens GA, Rehm J, Shield KD, et al. Regional contributions of six preventable risk factors to achieving the 25× 25 non-communicable disease mortality reduction target: a modelling study. Lancet Glob Health 2015;3:e746-e757 https://doi.org/10.1016/S2214-109X(15)00179-5.ArticlePubMed
- 2. Chobanian AV, Bakris GL, Black HR, Cushman WC, Green LA, Izzo JL Jr, et al. Seventh report of the Joint National Committee on Prevention, Detection, Evaluation, and Treatment of High Blood Pressure. Hypertension 2003;42:1206-1252 https://doi.org/10.1161/01.HYP.0000107251.49515.c2.ArticlePubMed
- 3. Chobanian AV. Shattuck lecture. The hypertension paradox--more uncontrolled disease despite improved therapy. N Engl J Med 2009;361:878-887 https://doi.org/10.1056/NEJMsa0903829.ArticlePubMed
- 4. Jayedi A, Rashidy-Pour A, Khorshidi M, Shab-Bidar S. Body mass index, abdominal adiposity, weight gain and risk of developing hypertension: a systematic review and dose-response meta-analysis of more than 2.3 million participants. Obes Rev 2018;19:654-667 https://doi.org/10.1111/obr.12656.ArticlePubMed
- 5. Lee CM, Huxley RR, Wildman RP, Woodward M. Indices of abdominal obesity are better discriminators of cardiovascular risk factors than BMI: a meta-analysis. J Clin Epidemiol 2008;61:646-653 https://doi.org/10.1016/j.jclinepi.2007.08.012.ArticlePubMed
- 6. Coutinho T, Goel K, Corrêa de Sá D, Kragelund C, Kanaya AM, Zeller M, et al. Central obesity and survival in subjects with coronary artery disease: a systematic review of the literature and collaborative analysis with individual subject data. J Am Coll Cardiol 2011;57:1877-1886 https://doi.org/10.1016/j.jacc.2010.11.058.ArticlePubMed
- 7. Koh H, Hayashi T, Sato KK, Harita N, Maeda I, Nishizawa Y, et al. Visceral adiposity, not abdominal subcutaneous fat area, is associated with high blood pressure in Japanese men: the Ohtori study. Hypertens Res 2011;34:565-572 https://doi.org/10.1038/hr.2010.271.ArticlePubMed
- 8. Chandra A, Neeland IJ, Berry JD, Ayers CR, Rohatgi A, Das SR, et al. The relationship of body mass and fat distribution with incident hypertension: observations from the Dallas Heart Study. J Am Coll Cardiol 2014;64:997-1002 https://doi.org/10.1016/j.jacc.2014.05.057.ArticlePubMed
- 9. Amato MC, Giordano C, Galia M, Criscimanna A, Vitabile S, Midiri M, et al. Visceral Adiposity Index: a reliable indicator of visceral fat function associated with cardiometabolic risk. Diabetes Care 2010;33:920-922 https://doi.org/10.2337/dc09-1825.ArticlePubMedPMC
- 10. Bozorgmanesh M, Hadaegh F, Azizi F. Predictive performances of lipid accumulation product vs. adiposity measures for cardiovascular diseases and all-cause mortality, 8.6-year follow-up: Tehran lipid and glucose study. Lipids Health Dis 2010;9:100 https://doi.org/10.1186/1476-511X-9-100.ArticlePubMedPMC
- 11. Stepien M, Stepien A, Banach M, Wlazel RN, Paradowski M, Rizzo M, et al. New obesity indices and adipokines in normotensive patients and patients with hypertension: comparative pilot analysis. Angiology 2014;65:333-342 https://doi.org/10.1177/0003319713485807.ArticlePubMed
- 12. Xia MF, Chen Y, Lin HD, Ma H, Li XM, Aleteng Q, et al. A indicator of visceral adipose dysfunction to evaluate metabolic health in adult Chinese. Sci Rep 2016;6:38214 https://doi.org/10.1038/srep38214.ArticlePubMedPMC
- 13. Wei J, Liu X, Xue H, Wang Y, Shi Z. Comparisons of visceral adiposity index, body shape index, body mass index and waist circumference and their associations with diabetes mellitus in adults. Nutrients 2019;11:1580 https://doi.org/10.3390/nu11071580.ArticlePubMedPMC
- 14. Wu J, Gong L, Li Q, Hu J, Zhang S, Wang Y, et al. A novel visceral adiposity index for prediction of type 2 diabetes and pre-diabetes in Chinese adults: a 5-year prospective study. Sci Rep 2017;7:13784 https://doi.org/10.1038/s41598-017-14251-w.ArticlePubMedPMC
- 15. Huang YC, Huang JC, Lin CI, Chien HH, Lin YY, Wang CL, et al. Comparison of innovative and traditional cardiometabolic indices in estimating atherosclerotic cardiovascular disease risk in adults. Diagnostics (Basel) 2021;11:603 https://doi.org/10.3390/diagnostics11040603.ArticlePubMedPMC
- 16. Sun JY, Hua Y, Zou HY, Qu Q, Yuan Y, Sun GZ, et al. Association between waist circumference and the prevalence of (Pre) hypertension among 27,894 US adults. Front Cardiovasc Med 2021;8:717257 https://doi.org/10.3389/fcvm.2021.717257.ArticlePubMedPMC
- 17. Li B, Wang J, Zhou X, Liu Y, Wang W, Gao Z, et al. Chinese visceral adiposity index is more closely associated with hypertension and prehypertension than traditional adiposity indices in Chinese population: results from the REACTION study. Front Endocrinol (Lausanne) 2022;13:921997 https://doi.org/10.3389/fendo.2022.921997.ArticlePubMedPMC
- 18. Han M, Qie R, Li Q, Liu L, Huang S, Wu X, et al. Chinese visceral adiposity index, a novel indicator of visceral obesity for assessing the risk of incident hypertension in a prospective cohort study. Br J Nutr 2021;126:612-620 https://doi.org/10.1017/S0007114520004298.ArticlePubMed
- 19. Kim HL, Lee EM, Ahn SY, Kim KI, Kim HC, Kim JH, et al. The 2022 focused update of the 2018 Korean Hypertension Society Guidelines for the management of hypertension. Clin Hypertens 2023;29:11 https://doi.org/10.1186/s40885-023-00234-9.ArticlePubMedPMC
- 20. Asia-Pacific Steering Committee. The Asian-Pacific perspective: redefining obesity and its treatment; 2000 [cited 2023 Dec 15]. Available from: https://iris.who.int/bitstream/handle/10665/206936/0957708211_eng.pdf.
- 21. American Diabetes Association. 2. Classification and diagnosis of diabetes: standards of medical care in diabetes-2021. Diabetes Care 2021;44(Suppl 1):S15-S33 https://doi.org/10.2337/dc21-S002.ArticlePubMed
- 22. Park SK, Ryoo JH, Oh CM, Choi JM, Kang JG, Lee JH, et al. Effect of overweight and obesity (defined by asian-specific cutoff criteria) on left ventricular diastolic function and structure in a general Korean population. Circ J 2016;80:2489-2495 https://doi.org/10.1253/circj.CJ-16-0625.ArticlePubMed
- 23. Wakabayashi I. Stronger associations of obesity with prehypertension and hypertension in young women than in young men. J Hypertens 2012;30:1423-1429 https://doi.org/10.1097/HJH.0b013e3283544881.ArticlePubMed
- 24. Tang L, Zhang F, Tong N. The association of visceral adipose tissue and subcutaneous adipose tissue with metabolic risk factors in a large population of Chinese adults. Clin Endocrinol (Oxf) 2016;85:46-53 https://doi.org/10.1111/cen.13013.ArticlePubMed
- 25. Deng WW, Wang J, Liu MM, Wang D, Zhao Y, Liu YQ, et al. Body mass index compared with abdominal obesity indicators in relation to prehypertension and hypertension in adults: the CHPSNE study. Am J Hypertens 2013;26:58-67 https://doi.org/10.1093/ajh/hps001.ArticlePubMed
- 26. Kanaya AM, Harris T, Goodpaster BH, Tylavsky F, Cummings SR; Health, Aging, and Body Composition (ABC) Study. Adipocytokines attenuate the association between visceral adiposity and diabetes in older adults. Diabetes Care 2004;27:1375-1380 https://doi.org/10.2337/diacare.27.6.1375.ArticlePubMed
- 27. Misra A, Vikram NK. Insulin resistance syndrome (metabolic syndrome) and obesity in Asian Indians: evidence and implications. Nutrition 2004;20:482-491 https://doi.org/10.1016/j.nut.2004.01.020.ArticlePubMed
- 28. Camhi SM, Bray GA, Bouchard C, Greenway FL, Johnson WD, Newton RL, et al. The relationship of waist circumference and BMI to visceral, subcutaneous, and total body fat: sex and race differences. Obesity (Silver Spring) 2011;19:402-408 https://doi.org/10.1038/oby.2010.248.ArticlePubMedPMC
- 29. Liu A, Byrne NM, Kagawa M, Ma G, Kijboonchoo K, Nasreddine L, et al. Ethnic differences in body fat distribution among Asian pre-pubertal children: a cross-sectional multicenter study. BMC Public Health 2011;11:500 https://doi.org/10.1186/1471-2458-11-500.ArticlePubMedPMC
- 30. Kapoor N, Furler J, Paul TV, Thomas N, Oldenburg B. Normal weight obesity: an underrecognized problem in individuals of South Asian descent. Clin Ther 2019;41:1638-1642 https://doi.org/10.1016/j.clinthera.2019.05.016.ArticlePubMed
- 31. Tian Q, Wang H, Kaudimba KK, Guo S, Zhang H, Gao S, et al. Characteristics of physical fitness and cardiometabolic risk in Chinese university students with normal-weight obesity: a crosssectional study. Diabetes Metab Syndr Obes 2020;13:4157-4167 https://doi.org/10.2147/DMSO.S280350.ArticlePubMedPMC
- 32. Chandra A, Neeland IJ, Berry JD, Ayers CR, Rohatgi A, Das SR, et al. The relationship of body mass and fat distribution with incident hypertension: observations from the Dallas Heart Study. J Am Coll Cardiol 2014;64:997-1002 https://doi.org/10.1016/j.jacc.2014.05.057.ArticlePubMed
- 33. Fox CS, Massaro JM, Hoffmann U, Pou KM, Maurovich-Horvat P, Liu CY, et al. Abdominal visceral and subcutaneous adipose tissue compartments: association with metabolic risk factors in the Framingham Heart Study. Circulation 2007;116:39-48 https://doi.org/10.1161/CIRCULATIONAHA.106.675355.ArticlePubMed
- 34. Alvarez GE, Beske SD, Ballard TP, Davy KP. Sympathetic neural activation in visceral obesity. Circulation 2002;106:2533-2536 https://doi.org/10.1161/01.CIR.0000041244.79165.25.ArticlePubMed
- 35. Seven E, Thuesen BH, Linneberg A, Jeppesen JL. Abdominal adiposity distribution quantified by ultrasound imaging and incident hypertension in a general population. Hypertension 2016;68:1115-1122 https://doi.org/10.1161/HYPERTENSIONAHA.116.07306.ArticlePubMed
- 36. Gómez-Ambrosi J, Silva C, Galofré JC, Escalada J, Santos S, Millán D, et al. Body mass index classification misses subjects with increased cardiometabolic risk factors related to elevated adiposity. Int J Obes (Lond) 2012;36:286-294 https://doi.org/10.1038/ijo.2011.100.ArticlePubMed
- 37. Janghorbani M, Salamat MR, Aminorroaya A, Amini M. Utility of the visceral adiposity index and hypertriglyceridemic waist phenotype for predicting incident hypertension. Endocrinol Metab (Seoul) 2017;32:221-229 https://doi.org/10.3803/EnM.2017.32.2.221.ArticlePubMedPMC
- 38. Hu L, Hu G, Huang X, Zhou W, You C, Li J, et al. Different adiposity indices and their associations with hypertension among Chinese population from Jiangxi province. BMC Cardiovasc Disord 2020;20:115 https://doi.org/10.1186/s12872-020-01388-2.ArticlePubMedPMC
REFERENCES
Figure & Data
References
Citations
- Association of traditional and novel obesity indicators with stroke risk: Findings from the Rural Chinese cohort study
Dongdong Zhang, Weifeng Huo, Weiling Chen, Xi Li, Pei Qin, Ming Zhang, Jing Li, Xizhuo Sun, Yu Liu, Dongsheng Hu
Nutrition, Metabolism and Cardiovascular Diseases.2024;[Epub] CrossRef
 PubReader
 ePub Link
 Cite
Cite