Articles
- Page Path
- HOME > Epidemiol Health > Volume 46; 2024 > Article
-
Original Article
Determinants of unhealthy living by gender, age group, and chronic health conditions across districts in Korea using the 2010-2017 Community Health Surveys -
Thi Tra Bui1
 , Thi Huyen Trang Nguyen1, Jinhee Lee2, Sun Young Kim3, Jin-Kyoung Oh1,2
 -
Epidemiol Health 2024;46:e2024014.
DOI: https://doi.org/10.4178/epih.e2024014
Published online: January 4, 2024
1Department of Cancer Control and Population Health, National Cancer Center Graduate School of Cancer Science and Policy, Goyang, Korea
2Division of Cancer Prevention, National Cancer Control Institute, National Cancer Center, Goyang, Korea
3Department of Cancer AI and Digital Health, National Cancer Control Institute, National Cancer Center, Goyang, Korea
- Correspondence: Jin-Kyoung Oh Department of Cancer Control and Population Health, National Cancer Center Graduate School of Cancer Science and Policy, 323 Ilsan-ro, Ilsandong-gu, Goyang 10408, Korea E-mail: jkoh@ncc.re.kr
© 2024, Korean Society of Epidemiology
This is an open-access article distributed under the terms of the Creative Commons Attribution License (http://creativecommons.org/licenses/by/4.0/), which permits unrestricted use, distribution, and reproduction in any medium, provided the original work is properly cited.
- 2,654 Views
- 77 Download
Abstract
-
OBJECTIVES
- We investigated the prevalence and determinants of unhealthy living by gender, age, and comorbidities across Korean districts.
-
METHODS
- For 806,246 men and 923,260 women from 245 districts who participated in the 2010-2017 Korean Community Health Surveys, risk scores were calculated based on obesity, physical inactivity, smoking, and high-risk alcohol consumption, each scored from 0 (lowest risk) to 2 (highest risk). A risk score ≥4 was defined as indicating unhealthy living, and weighted proportions were calculated for each district. Using multivariate regression, an ecological model including community socioeconomic, interpersonal, and neighborhood factors was examined by gender, age, and comorbidities.
-
RESULTS
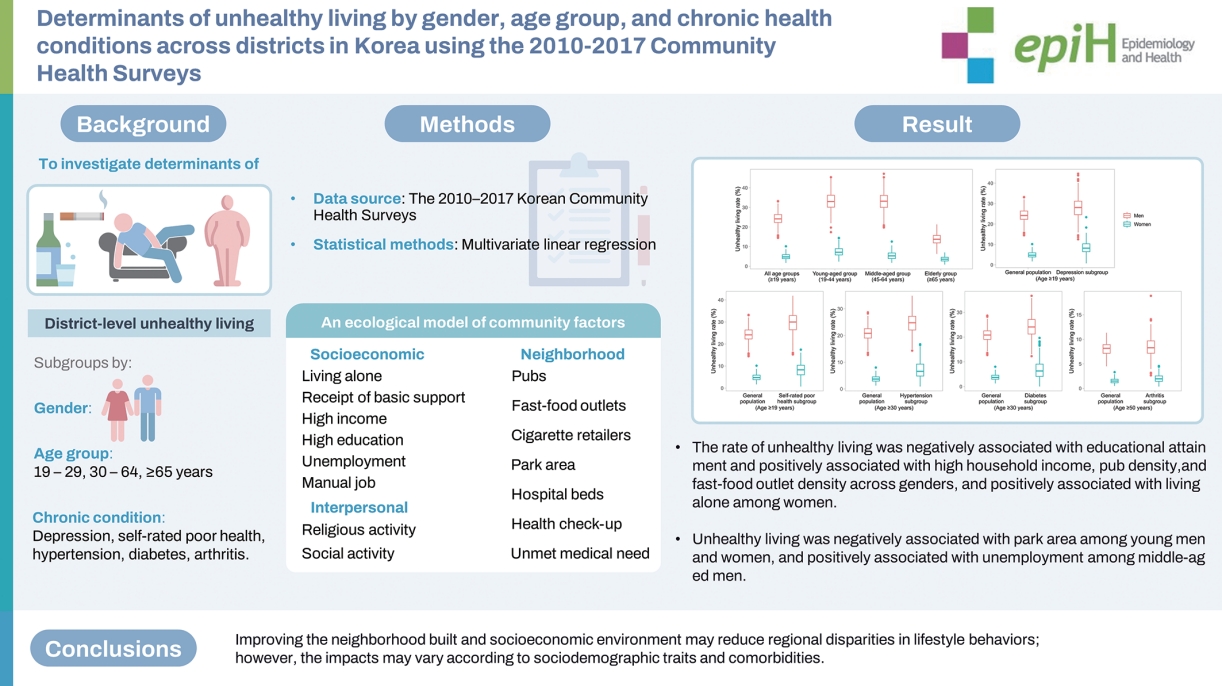
- The mean age-standardized rate of unhealthy living was 24.05% for men and 4.91% for women (coefficients of variation, 13.94% and 29.51%, respectively). Individuals with chronic diseases more frequently exhibited unhealthy lifestyles. Unhealthy lifestyles were associated with educational attainment (β-coefficients: men, -0.21; women, -0.15), high household income (β=0.08 and 0.03, respectively), pub density (β=0.52 and 0.22, respectively), and fast-food outlet density (β=2.81 and 1.63, respectively). Negative associations were observed with manual labor, social activity participation, and hospital bed density. Unhealthy living was positively associated with living alone among women and with being unemployed among middle-aged men. Access to parks was negatively associated with unhealthy living among young men and women. The ecological model explained 32% of regional variation in men and 41% in women.
-
CONCLUSIONS
- Improving the neighborhood built and socioeconomic environment may reduce regional disparities in lifestyle behaviors; however, the impacts may vary according to socio-demographic traits and comorbidities.
- • District prevalence rates of unhealthy living were higher among men than women and decreased with advancing age.
- • Efforts to reduce regional disparities in lifestyle behaviors could benefit from enhancements to the neighborhood environment and the socioeconomic status of the area.
- • The effectiveness of such improvements may vary based on socio-demographic characteristics and health conditions.
Key Message
- Behavioral risk factors, including high-risk alcohol consumption, smoking, obesity, physical inactivity, and poor diet, impose an enormous burden on global health [1,2]. Unhealthy behaviors have been estimated to contribute to 60% of the causes of chronic diseases [3], leading to over 23 million deaths and constituting 36.5% of disability-adjusted life years in 2017 [4]. Beyond physical health, behavioral risk factors are associated with poor mental well-being [5,6]. Importantly, these risk factors often cluster within individuals and may interact, amplifying their impact on health [7,8]. As such, addressing clustered unhealthy lifestyle behaviors is crucial in the prevention and management of chronic diseases [1,3]. While people residing in the same area tend to exhibit similar lifestyle patterns, lifestyle risk factors may be unevenly distributed across regions, contributing to health disparities [3,9]. Consequently, understanding the clustering of unhealthy lifestyles through a community-based approach is vital for informing public health policies, especially those focused on community health.
- Furthermore, studies have shown that unhealthy lifestyle patterns are associated with socio-demographic characteristics and health conditions [10-12]. Previous research has indicated that certain behavioral risk factors are more prevalent in women, while others are more common in men; moreover, these gender differences often vary with age [13]. A direct comparison of the crude prevalence of clustered unhealthy lifestyles in patients with chronic diseases to that of the general population could yield a skewed interpretation, as chronic diseases are more frequently observed in older individuals [14]. To address age and gender differences, some studies have employed standardized estimates or adjusted for those factors using statistical models [9,15]. However, these approaches may obscure the full nuances of factors associated with health practices in men and women across age groups, which could be better understood through a stratified analysis. In addition, heterogeneity across studies, such as the definitions of clustered unhealthy lifestyles and the covariates examined, can impede the synthesis of findings from multiple studies, which is necessary to gain a broader understanding of health lifestyles among diverse subpopulations [12,15,16].
- As such, it is important to explore the clustering of unhealthy lifestyles at the regional level, while considering socio-demographic traits and health conditions. In Korea, addressing regional health disparities has been recognized as a goal for achieving health equity, as outlined in the National Health Plan 2020 [17]. The present study was designed to examine the prevalence and determinants of clustered unhealthy lifestyles across 245 districts in Korea, stratified by gender, age group, and major chronic health conditions, including depression, self-rated poor health, hypertension, diabetes, and arthritis. For this purpose, we employed the composite measure of lifestyle risk score, calculated as the sum of individual risk scores for each factor based on the level of risk [18]. The value of this indicator has been demonstrated in various studies at the individual level [18]; however, it has not yet been applied in an ecological investigation. In our research, the lifestyle risk score was derived from 4 key risk factors for chronic diseases: cigarette smoking, alcohol consumption, obesity, and physical inactivity. At the community level, we estimated the rate of unhealthy living as the prevalence of clustered unhealthy behaviors. To enable comparison across subpopulations, we utilized the same ecological model for all subgroups, applying age-standardized rates of unhealthy living.
INTRODUCTION
- Data source and study participants
- The Korea Community Health Survey (KCHS) is a nationwide community-based survey conducted annually by the Korea Disease Control and Prevention Agency since 2008. Each district includes approximately 900 participants aged 19 years or older, amounting to a total of about 220,000 participants per year. To ensure the representativeness and reliability of the data, random sampling methods are utilized. The KCHS is carried out by trained interviewers who visit the households of the selected participants. The data collected by the KCHS encompass socioeconomic characteristics, health practices and behaviors, utilization of medical services, and common health issues. This information is gathered through face-to-face interviews using a structured questionnaire. Further details regarding the KCHS can be found in previously published research [19].
- To obtain more precise community-level estimates, we pooled the data from 1,830,260 individuals who participated in the 2010- 2017 KCHS. The units of analysis were 245 districts, which were reclassified to reflect changes in administrative divisions over the study period [20]. After excluding 100,754 individuals due to incomplete data for height, weight, physical activity, smoking, or alcohol consumption, our study population consisted of 1,729,506 participants, comprising 806,246 men and 923,260 women. As not every common health outcome in the KCHS was recorded annually, we focused on 5 subgroups corresponding to specific comorbidities [14,19]. The subgroup of participants with poor subjective health included individuals who self-reported their health status as “poor” or “very poor”. The depression subgroup encompassed those who had experienced depressive symptoms for more than 2 weeks in the preceding year. The hypertension subgroup was made up of people aged 30 years or older who had received a hypertension diagnosis from a physician. Similarly, the diabetes subgroup included individuals aged 30 years or older diagnosed with diabetes, and the arthritis subgroup consisted of those aged 50 years or older with an arthritis diagnosis. Age restrictions for these subgroups were based on the KCHS Data Usage Guidelines (http://chs.cdc.go.kr). The general characteristics of the study participants are detailed in Supplementary Material 1.
- Information regarding covariates was estimated from the individual-level KCHS data or sourced from the Korean Statistical Information Service website (https://kosis.kr) (Table 1).
- Measurements
- Lifestyle indices can vary across studies, but they typically include factors such as smoking, alcohol consumption, physical inactivity, excess weight, and diet [18]. Due to a lack of dietary data, the lifestyle risk score used in this study was composed of 4 unhealthy characteristics or practices: obesity, physical inactivity, smoking, and high-risk alcohol consumption. Prior research has often characterized integrated unhealthy or healthy lifestyle patterns based on the number of lifestyle risk factors or healthy behaviors [11,15,21]. Considering the level of risk associated with each factor, a 3-tiered scoring system was applied in the present study, with scores ranging from 0 (indicating the lowest risk) to 2 (representing the highest risk) [22-24] (Supplementary Material 2). For each district, the prevalence of unhealthy living was estimated as the weighted proportion of participants with a lifestyle risk score of 4 or higher. This calculation was stratified by gender, age group, and comorbid conditions. Age-standardized rates of unhealthy living were employed in regression analyses, apart from the age group-stratified analyses, which used age-specific crude rates. The standard population for these calculations was the 2014 Korean population.
- We employed an ecological model that incorporated community socioeconomic factors, community interpersonal factors, and community neighborhood factors (Table 1). The community socioeconomic factors included rates of living alone, receipt of basic living support, high equivalized household income, high education level, unemployment, and manual labor. We hypothesized that districts with higher rates of favorable socioeconomic conditions would display lower rates of unhealthy living. The community interpersonal factors examined included the rates of religious and social participation. We anticipated that greater participation in these activities would be associated with lower unhealthy living rates. The community neighborhood factors encompassed the density of pubs, fast-food outlets, and cigarette retailers per 1,000 residents, along with the per capita park area, the number of hospital beds per 1,000 residents, the health check-up participation rate, and the rate of unmet medical needs. We expected that easier access to alcohol, fast food, and tobacco would promote unhealthy living habits. In contrast, the availability of healthcare services and facilities was hypothesized to contribute to a lower rate of unhealthy living by encouraging participation in health promotion programs. Multiple studies have demonstrated associations between these factors and lifestyle practices [9,12,15,21]. The model included age-standardized rates for covariates.
- Statistical analysis
- Means, standard deviations (SDs), and minimum and maximum values were calculated for both the risk score and the rates of clustered unhealthy lifestyle behaviors at the community level, using several risk score thresholds (≥ 2, ≥ 4, and ≥ 6). A score of 4 or higher was determined to be the most suitable cut-off for defining unhealthy living in the regression analyses. Descriptive statistics were then provided for the estimated prevalence of unhealthy living, broken down by this risk score categorization and further stratified by gender, age group, and comorbidities. To account for the complex sampling design of the KCHS, weights were applied using PROC SURVEY procedures in SAS version 9.4 (SAS Institute Inc., Cary, NC, USA). Regional variations in unhealthy living rates were assessed based on the coefficient of variation (CV), which represents the ratio of the SD to the mean, expressed as a percentage. Multiple linear regression analysis was used to identify determinants of unhealthy living by gender and age group in the general population, including those with and without comorbidities, as well as among subgroups with major chronic health conditions. The results of these analyses were reported in terms of regression coefficients and the explanatory power of the models, as indicated by R-squared (R2) values. The contribution of each covariate to the regional variation in unhealthy living rate was evaluated by subtracting the R2 value of a reduced model that excluded the covariate in question from that of the full model, which included all covariates. To support the main findings, regression analyses were conducted for individual risk factors and types of residential areas, categorized by administrative districts: gu for metropolitan, si for urban, and gun for rural areas [20].
- Ethics statement
- The Korean Community Health Survey protocols received approval from the Research Ethics Review Committee of the Korea Centers for Disease Control and Prevention (2010-02CON-22-P; 2012-07CON-01-2C; 2014-08EXP-09-4C-A; 2016-10-01-P-A). The present study was granted an exemption from review by the Institutional Review Board of the National Cancer Center, Korea (NCC2023-0114).
MATERIALS AND METHODS
Dependent variable
Independent variables
- Community-level prevalence of unhealthy living
- The mean risk score was 2.68 (CV= 8.25%) for men and 1.80 (CV= 10.59%) for women across the 245 districts (Table 2). The mean age-standardized prevalence of a risk score of 4 or higher was 24.05% among men and 4.91% among women, with variation among districts (CV= 13.94% for men, 29.51% for women). The prevalence of clustered unhealthy lifestyle behaviors varied substantially according to different categorizations based on the risk score. For instance, up to 61.68% of men (CV= 5.61%) and 54.95% of women (CV= 10.55%) had a risk score of 2 or higher, whereas 4.91% of men (CV= 23.82%) and 0.36% of women (CV= 51.93%) had a risk score of 6 or higher. Unhealthy living was considered to be indicated by a risk score of 4 or above. In the general population, substantial gender differences in the rates of unhealthy living were observed across all age groups, with men more prone to engage in unhealthy behaviors than women (Figure 1 and Table 2). Regarding age, the prevalence of unhealthy living reached its peak in middle-aged men (defined as men 45-64 years old) and in younger women (defined as those 19-44 years old). Compared to rural areas, urban and metropolitan regions displayed higher rates of unhealthy living among both men and women. However, these disparities in unhealthy living rates decreased after age standardization. The variation in rate across districts was more pronounced for women than for men. Relative to the general population, the age-standardized prevalence of unhealthy living was elevated in subgroups with chronic health conditions, with the exception of those with arthritis.
- Community-level determinants of unhealthy living
- Table 3 presents the results of regression analyses identifying factors associated with unhealthy living at the community level, differentiated by gender and age group. Across genders, the prevalence of unhealthy living was negatively associated with educational attainment and positively associated with higher household income and the density of pubs and fast-food outlets. Additionally, inverse associations were observed with the prevalence of individuals engaged in manual labor, social activities, and the density of hospital beds. Among women, a positive association was found between unhealthy living prevalence and the proportion of individuals living alone. Our model accounted for 32% of the regional variation in unhealthy living rates among men and 41% among women. For both men and women, community neighborhood factors contributed the greatest explanatory power.
- Across age groups, the rate of unhealthy living was consistently and significantly associated with educational attainment for both men and women, with the density of pubs for men, and with the density of fast-food outlets for women (Table 3). Certain determinants were identified for specific age groups. For example, for both men and women within the youngest age group, a negative association was observed between unhealthy living and access to parks. Additionally, for men and women aged 45 years and older, unhealthy living was negatively associated with the rates of health check-ups and unmet medical needs. In contrast, a positive association with the unemployment rate was noted among middle-aged men. Notably, the rate of participation in religious activities displayed a negative association with unhealthy living among young men but a positive association among middle-aged women. The explanatory power of the model was highest for the middle-aged subgroups (41% for men and 44% for women).
- The potential determinants of unhealthy living appeared to differ across subgroups categorized by chronic disease status (Table 4). However, a consistent positive association with the density of fast-food outlets was observed across disease and gender subgroups, with the exception of men with arthritis and women with depression. For women, educational attainment and per capita park area remained important protective determinants. Among men with hypertension or diabetes, a positive relationship was noted between unhealthy living and the rate of health check-ups. The rate of unemployment was positively associated with unhealthy living in the arthritis subgroup regardless of gender. Our model was able to moderately explain the regional differences in unhealthy living within the major chronic health condition subgroups (R2, 10-23% in men and 12-26% in women).
RESULTS
- In this study, we examined the prevalence and determinants of unhealthy living at the community level, differentiated by gender, age group, and the presence of major chronic health conditions. The rate of unhealthy living was markedly higher among men than among women and decreased with advancing age. Individuals with depression, self-perceived poor health, hypertension, or diabetes were particularly prone to engage in multiple unhealthy behaviors. Our ecological model explained 32% and 41% of the variation in unhealthy living among healthy men and women, respectively, across districts. However, it only modestly accounted for the variation among subgroups categorized by chronic disease status. The determinants of unhealthy living appeared to vary based on gender, age group, and the presence of comorbidities. Educational attainment and the availability of pubs and fast-food outlets emerged as particularly important determinants, supporting our hypotheses.
- Several studies have demonstrated gender disparities in unhealthy lifestyle behaviors [11,25]. Men may tend to engage in risky substance use, whereas women are generally less likely to smoke or consume alcohol due to societal stigma, particularly in Asian cultures [13,25,26]. Conversely, women are often less actively involved in physical activity, as family responsibilities often take precedence and present practical challenges [25,27]. Furthermore, obesity rates among Korean women exceed those of Korean men [28]. Thus, it was anticipated that a markedly higher rate of unhealthy living—an integrated indicator—among men would primarily be attributed to gender differences in tobacco and alcohol use. Both elderly men and elderly women often quit or reduce their smoking and drinking habits as they become more aware of the adverse health impacts associated with these behaviors [29]. Separately, social expectations of being “a good wife and wise mother” may deter middle-aged women from participating in these unhealthy practices after marriage [26]. A prior study indicated that health behaviors among individuals with chronic diseases were not better, and were in some cases worse, than those observed in the general population [14]. In our research, we distinctly noted a higher age-standardized rate of unhealthy living among subgroups with chronic health conditions, arthritis patients being the exception.
- Regarding community socioeconomic factors, unhealthy living was negatively associated with educational attainment across all age groups and genders. Educational attainment was the largest contributor to regional disparities in unhealthy living among the various factors examined. Notably, the explanatory power of educational attainment alone (R2 = 0.07 in men, 0.13 in women) was considerably smaller than that of the full model (R2 = 0.32 in men, 0.41 in women), which accounted for other covariates that were controlled for and to some extent correlated with each other. When stratified by residential area, educational attainment continued to be a key determinant of the rate of unhealthy living in metropolitan areas (for both men and women) and in urban areas (for women) (Supplementary Material 3). A previous study utilizing the 2010 KCHS data indicated that low educational attainment was linked to a lower prevalence of healthy lifestyles, corroborating our findings [11]. More highly educated individuals may make healthier choices due to greater financial capacity and health literacy [30]. Unhealthy behaviors such as smoking are potentially associated with low self-control, an attraction to risk, and a preference for immediate gratification over long-term well-being, which may be more common among those with lower educational attainment [31]. In the subgroups of participants with chronic health conditions, this association was not evident among men, while it was clearly present among women. Analysis of specific lifestyle practices in men participants revealed that educational attainment was negatively associated with smoking but positively associated with obesity, physical inactivity, and high-risk alcohol consumption, although these associations were not statistically significant (Supplementary Material 4). Evidence suggests that more highly educated men tend to have sedentary jobs with long working hours or to engage in high-risk alcohol consumption as part of workplace culture. Moreover, compared to women, men are more prone to underestimating their body size [32].
- Regarding community interpersonal factors, a negative association was observed between unhealthy living and participation in social activities among young and middle-aged women, supporting our hypotheses. Social connections may encourage healthy behaviors through the fostering of positive psychological states, yet they may also promote undesirable behaviors, such as smoking or alcohol consumption [33]. A previous study suggested that the specific activities engaged in may hold more importance for health and well-being than the general nature of social involvement [34]. Future research should employ specific measures of social activity to confirm this finding. In the present study, we noted a negative association between unhealthy living and participation in religious activities among young men, but we found a positive relationship among middle-aged women. Engagement in religious activities may promote healthy habits at the community level by disseminating health information and establishing social norms that support healthy living and discourage risky behaviors [21]. At the individual level, religious activities may contribute to stress reduction and enhanced resilience [35]. Many religions also impose restrictions on substance use, such as smoking and heavy drinking [35]. However, religious moral perspectives may exhibit less social stigma towards individuals with obesity, rendering religious organizations a comforting and inclusive environment [36]. A study among postmenopausal women identified links between regular worship attendance and both non-smoking and moderate alcohol consumption, but it did not reveal a significant association with regular exercise or a diet low in saturated fat and calories [37].
- In examining community neighborhood factors, we observed a negative association between unhealthy living and park area per capita among young adults regardless of gender, as well as among subgroups of women with chronic diseases. Green spaces appear to offer natural benefits, potentially aiding in healing and providing a buffer against depression, air pollution, noise, and heat waves [38]. The availability of green spaces not only encourages physical activity [12] but also may support the cessation of other risky behaviors through neurobiological pathways, such as enhanced self-efficacy and a strengthened sense of control [35]. Previous research indicated that physical activity rates were comparatively high in men and tended to decrease with age [39]. This trend could reflect the alignment with both aging processes and cultural expectations across genders [39]. A negative association was also identified between unhealthy living and the density of hospital beds for women of all ages, as well as for chronic disease subgroups. In Korea, the concentration of medical beds in urban centers [40] suggests that regions with sparse population may experience relatively poor access to medical services. This is supported by previous research indicating that women in smaller cities are less inclined to adopt healthy behaviors [12], which aligns with our results. The inverse association between unhealthy living and the rate of health check-ups in middle-aged and older men could be linked to heightened health awareness, which often comes with advancing age [41]. In contrast to findings from individual-level research [16], we identified a negative association between unhealthy living and unmet medical needs in middle-aged and older women. Women in rural areas were more likely to experience unmet healthcare needs than those in other settings [42]. Nevertheless, studies have shown that elderly rural residents tend to exhibit comparatively healthy behaviors, such as being more physically active and having lower obesity rates [43]. Women residing in areas of high socioeconomic status, by contrast, were more prone to smoking, a trend that might be explained by the concept of relative deprivation [44].
- This study also identified several community-level factors that were positively associated with unhealthy living. Among middle-aged women, unhealthy living was linked to a higher prevalence of residing alone. Living alone, as opposed to cohabiting, has been found to be associated with worse physical and mental health, greater social isolation, and lower socioeconomic status [45]. To manage induced stress and depression, individuals living alone might turn to smoking, drinking, inactivity, or overeating as forms of relaxation [31,45]. Additionally, it is possible that unmarried, widowed, or divorced women may become habitual smokers due to the absence of perceived social constraints or peer support to encourage quitting [31]. Contrary to our hypothesis, districts with greater rates of high equivalized household income tended to exhibit higher rates of unhealthy living. Stratified by residential area, this pattern was only observed in rural districts, which was not statistically significant (Supplementary Material 3). One previous study indicated that high financial independence was not associated with healthy lifestyle, leaving the causal link between better financial autonomy in a community and the presence of infrastructure promoting healthy living unclear [15]. This underscores the importance of resource distribution at the community level. We also observed a positive association between unemployment and unhealthy living among middle-aged men and arthritis patients regardless of gender. Unemployment can lead to financial stress and depression [46], conditions that may be particularly likely to manifest during middle age—a period typically characterized by peak economic productivity—or among arthritis patients due to limited mobility. Unemployment may prompt individuals to seek immediate gratification through behaviors like smoking or alcohol consumption, without fully considering the long-term health implications [47]. Regarding community neighborhood factors, a higher rate of unhealthy living was consistently associated with a greater density of pubs and fast-food outlets across the general population and among chronic disease subgroups, regardless of gender. This finding aligns with previous research [9,15,31]. The concentrations of these establishments helped account for geographic disparities in unhealthy living rates in both urban and rural areas, though not in metropolitan regions (Supplementary Material 3). Previous research has demonstrated that communities with a greater density of alcohol outlets face a higher risk of issues related to excessive drinking [48]. Since these outlets have been found to be more dense in deprived areas, where excessive drinkers are more susceptible to alcohol-related harm compared to those in more advantaged areas, these findings suggest that policy interventions to limit alcohol availability may help to reduce health disparities [48,49]. A Dutch study highlighted the link between the proximity of fast-food outlets within 500 m and increased body mass index, with this association being stronger in rural areas than urban ones [50]. This finding may be attributed to the scarcity and limited operating hours of healthy food options, such as supermarkets, in rural locations [50].
- Based on our findings, in addition to the improvement of socioeconomic conditions in the area, we suggest that the enhancement of neighborhood environments may contribute to promoting healthy lifestyles. Policies limiting the availability of alcohol should be reinforced, and nutritious food should be made more readily available. Primary care has the potential to offer health promotion services or programs, including nutrition counseling, smoking cessation services, or interventions to increase physical activity. Thus, strengthening the primary care system can aid in addressing regional health disparities. Proactive strategies are necessary to promote healthy living among individuals with chronic diseases.
- This study had several strengths. First, we employed the KCHS, a large-scale nationwide population-based survey, which enabled us to generate representative indicators at the community level. Second, we utilized lifestyle risk score as a singular indicator of the combination of unhealthy behaviors, providing us with a broader perspective on lifestyle practices across regions. Additionally, our ecological model incorporated multiple covariates that were either age-standardized or specified according to age, gender, and comorbidities. Regarding limitations, the present ecological analysis examined data across communities, which may yield results that differ from those obtained through individual-level investigation. We also assumed that several community neighborhood factors uniformly impacted all individuals within the subpopulations. Furthermore, as this study relied on survey data, we could not establish a causal relationship between unhealthy lifestyles and the examined covariates. Additionally, the use of self-reported data in this study may have introduced bias due to underreporting or over-reporting.
- In summary, the rates of unhealthy living at the community level were higher among men than women and decreased with advancing age. Efforts to reduce regional disparities in lifestyle behaviors could benefit from enhancements to the neighborhood environment and the socioeconomic status of the area. The effectiveness of such improvements may vary based on socio-demographic characteristics and health conditions.
DISCUSSION
Data availability
Supplementary materials
Supplementary Material 1.
Supplementary Material 2.
Supplementary Material 3.
Supplementary Material 4.
-
Conflict of interest
The authors have no conflicts of interest to declare for this study.
-
Funding
This study received support from the Korean Disease Control and Prevention Agency (grant No. 2733-5488) and partial support from the National Cancer Center (grant No. NCC-2310652).
-
Author contributions
Conceptualization: Bui TT, Oh JK, Kim SY. Formal analysis: Bui TT. Funding acquisition: Oh JK, Bui TT. Methodology: Kim SY, Nguyen THT, Lee J, Bui TT. Writing – original draft: Bui TT. Writing – review & editing: Oh JK, Kim SY, Lee J, Nguyen THT.
NOTES
ACKNOWLEDGEMENTS


| Variables | Definition | Data source | Year | |
|---|---|---|---|---|
| Dependent variable | Unhealthy living1 | Weighted proportion of participants with a lifestyle risk score of 4 or higher; lifestyle risk score includes obesity, physical inactivity, smoking, and high-risk alcohol consumption, with each scored between 0 (lowest risk) and 2 (highest risk) | KCHS | 2010-2017 |
| Independent variables | ||||
| Community socioeconomic factors1 | Living alone | Weighted proportion of participants living alone (%) | KCHS | 2014 |
| Receipt of basic support | Weighted proportion of participants receiving basic living support (%) | KCHS | 2014 | |
| High income | Weighted proportion of participants with equivalized household incomes higher than the median of equivalized household income among participants (%) | KCHS | 2013 | |
| High education | Weighted proportion of participants who graduated from university or higher (%) | KCHS | 2014 | |
| Unemployment | Weighted proportion of participants aged under 65 yr reporting unemployment (%) | KCHS | 2014 | |
| Manual job | Weighted proportion of participants aged under 65 yr with jobs involving manual labor (%) | KCHS | 2014 | |
| Community interpersonal factors | Religious activity1 | Weighted proportion of participants who participate in religious activities at least once a month (%) | KCHS | 2015 |
| Social activity1 | Weighted proportion of participants who participate in social activities (class gatherings, alumni associations, events at senior citizen centers, etc.) at least once a month (%) | KCHS | 2015 | |
| Community neighborhood factors | Pubs | No. of pubs per 1,000 people | KOSIS | 2014 |
| Fast-food outlets | No. of fast-food outlets (pizza, hamburger, sandwich, or chicken restaurants) per 1,000 people | KOSIS | 2014 | |
| Cigarette retailers | No. of cigarette retailers per 1,000 people | KOSIS | 2014 | |
| Park area | Park area per person (m2) | KOSIS | 2014 | |
| Hospital beds | No. of beds in medical hospitals per 1,000 people | KOSIS | 2014 | |
| Health check-ups1 | Weighted proportion of participants who received health check-ups within the prior 2 yr (excluding cancer screening) (%) | KCHS | 2014 | |
| Unmet medical need1 | Weighted proportion of participants reporting unmet medical need (not including dental care) in the prior year (%) | KCHS | 2014 |
| Variables |
Age (yr) |
|||||||
|---|---|---|---|---|---|---|---|---|
|
Total |
19-44 |
45-64 |
≥65 |
|||||
| β1 | R2 | β2 | R2 | β2 | R2 | β2 | R2 | |
| Men | - | 0.32 | - | 0.25 | - | 0.41 | - | 0.25 |
| Community socioeconomic factors | - | 0.09 | - | 0.06 | - | 0.13 | - | 0.04 |
| Living alone | 0.04 | 0.00 | -0.02 | 0.00 | 0.11 | 0.00 | 0.05 | 0.00 |
| Recipient of basic support | -0.13 | 0.00 | -0.25 | 0.01 | -0.43*** | 0.02 | 0.06 | 0.00 |
| High income | 0.08** | 0.01 | 0.04 | 0.01 | 0.07** | 0.01 | 0.05** | 0.01 |
| High education | -0.21*** | 0.07 | -0.13*** | 0.02 | -0.17*** | 0.07 | -0.07*** | 0.02 |
| Unemployment | 0.04 | 0.00 | 0.04 | 0.00 | 0.20** | 0.01 | - | - |
| Manual job | -0.07 | 0.01 | 0.05 | 0.00 | -0.09** | 0.01 | - | - |
| Community interpersonal factors | - | 0.02 | - | 0.05 | - | 0.01 | - | 0.00 |
| Religious activity | -0.06 | 0.01 | -0.16*** | 0.04 | -0.03 | 0.00 | -0.01 | 0.00 |
| Social activity | -0.06 | 0.01 | -0.05 | 0.01 | -0.06 | 0.01 | -0.01 | 0.00 |
| Community neighborhood factors | - | 0.11 | - | 0.10 | - | 0.13 | - | 0.16 |
| Pubs | 0.52*** | 0.03 | 0.86*** | 0.04 | 0.56** | 0.01 | 0.46*** | 0.03 |
| Fast-food outlets | 2.81*** | 0.03 | 2.07 | 0.01 | 3.75*** | 0.03 | 1.81** | 0.02 |
| Cigarette retailers | -2.66 | 0.00 | -5.31 | 0.00 | 1.66 | 0.00 | -1.40 | 0.00 |
| Park area | -0.02 | 0.01 | -0.03** | 0.01 | -0.02 | 0.01 | -0.02 | 0.01 |
| Hospital beds | -0.03 | 0.01 | -0.04 | 0.00 | -0.04 | 0.00 | -0.04 | 0.01 |
| Health check-ups | -0.07 | 0.01 | 0.04 | 0.00 | -0.21*** | 0.05 | -0.10*** | 0.05 |
| Unmet medical need | 0.05 | 0.00 | 0.06 | 0.00 | -0.04 | 0.00 | -0.02 | 0.00 |
| Women | - | 0.41 | - | 0.33 | - | 0.44 | - | 0.25 |
| Community socioeconomic factors | - | 0.15 | - | 0.06 | - | 0.17 | - | 0.07 |
| Living alone | 0.09*** | 0.03 | 0.02 | 0.00 | 0.05** | 0.01 | 0.01 | 0.00 |
| Recipient of basic support | -0.02 | 0.00 | -0.08 | 0.00 | -0.01 | 0.00 | 0.07*** | 0.02 |
| High income | 0.03** | 0.01 | 0.01 | 0.00 | 0.02 | 0.01 | 0.02** | 0.01 |
| High education | -0.15*** | 0.13 | -0.08*** | 0.05 | -0.11*** | 0.12 | -0.09*** | 0.04 |
| Unemployment | -0.05 | 0.00 | -0.01 | 0.00 | 0.01 | 0.00 | - | - |
| Manual job | -0.06** | 0.02 | -0.01 | 0.00 | -0.04** | 0.02 | - | - |
| Community interpersonal factors | - | 0.02 | - | 0.04 | - | 0.05 | - | 0.01 |
| Religious activity | 0.01 | 0.00 | -0.03 | 0.01 | 0.04*** | 0.03 | 0.01 | 0.01 |
| Social activity | -0.03*** | 0.02 | -0.04*** | 0.03 | -0.04*** | 0.03 | 0.00 | 0.00 |
| Community neighborhood factors | - | 0.17 | - | 0.17 | - | 0.21 | - | 0.13 |
| Pubs | 0.22*** | 0.02 | 0.53*** | 0.06 | 0.21** | 0.01 | 0.03 | 0.00 |
| Fast-food outlets | 1.63*** | 0.05 | 1.34** | 0.01 | 2.41*** | 0.07 | 1.44*** | 0.05 |
| Cigarette retailers | -1.90 | 0.00 | -5.20 | 0.01 | -0.79 | 0.00 | 0.20 | 0.00 |
| Park area | -0.01 | 0.01 | -0.02*** | 0.03 | 0.00 | 0.00 | 0.00 | 0.00 |
| Hospital beds | -0.03*** | 0.03 | -0.05*** | 0.04 | -0.04*** | 0.03 | -0.02*** | 0.02 |
| Health check-ups | -0.02 | 0.00 | -0.02 | 0.00 | -0.02 | 0.00 | -0.02 | 0.01 |
| Unmet medical need | -0.02 | 0.00 | 0.00 | 0.00 | -0.05** | 0.01 | -0.04*** | 0.03 |
β, regression coefficient; R2, R-squared value.
1 Estimated from regression models including age-standardized rates of unhealthy living as the dependent variable and age-standardized rates of covariates (except the densities of pubs, fast-food outlets, and cigarette retailers, as well as hospital beds per 1,000 people and park area per person, using crude estimates) as independent variables.
2 Estimated from regression models including age-specific crude rates of unhealthy living as the dependent variable and age-specific crude rates of covariates (except the densities of pubs, fast-food outlets, and cigarette retailers, as well as hospital beds per 1,000 people and park area per person, using crude rates for all age groups) as independent variables.
** p<0.01,
*** p<0.001.
| Variables |
Depression |
Self-rated poor health |
Hypertension |
Diabetes |
Arthritis |
|||||
|---|---|---|---|---|---|---|---|---|---|---|
| β | R2 | β | R2 | β | R2 | β | R2 | β | R2 | |
| Men | - | 0.12 | - | 0.23 | - | 0.17 | - | 0.15 | - | 0.10 |
| Community socioeconomic factors | - | 0.03 | - | 0.05 | - | 0.03 | - | 0.03 | - | 0.06 |
| Living alone | 0.00 | 0.00 | 0.02 | 0.00 | 0.06 | 0.01 | -0.06 | 0.00 | -0.03 | 0.00 |
| Recipient of basic support | 0.01 | 0.00 | -0.02 | 0.00 | -0.20 | 0.01 | -0.03 | 0.00 | -0.06 | 0.01 |
| High income | 0.01 | 0.00 | 0.07** | 0.02 | 0.02 | 0.00 | 0.07** | 0.02 | 0.00 | 0.00 |
| High education | -0.03 | 0.00 | 0.01 | 0.00 | -0.05 | 0.01 | 0.01 | 0.00 | -0.07 | 0.01 |
| Unemployment | 0.08 | 0.01 | 0.06 | 0.00 | 0.07 | 0.00 | 0.13 | 0.01 | 0.14*** | 0.03 |
| Manual job | 0.09** | 0.02 | -0.04 | 0.00 | 0.05 | 0.01 | 0.05 | 0.01 | 0.00 | 0.00 |
| Community interpersonal factors | - | 0.00 | - | 0.01 | - | 0.01 | - | 0.00 | - | 0.01 |
| Religious activity | -0.04 | 0.00 | -0.08 | 0.01 | -0.06 | 0.01 | -0.03 | 0.00 | 0.01 | 0.00 |
| Social activity | 0.02 | 0.00 | 0.01 | 0.00 | -0.01 | 0.00 | 0.02 | 0.00 | 0.03 | 0.00 |
| Community neighborhood factors | - | 0.07 | - | 0.11 | - | 0.13 | - | 0.09 | - | 0.04 |
| Pubs | 0.32 | 0.00 | 0.50 | 0.01 | 0.49** | 0.02 | 0.45 | 0.01 | 0.12 | 0.00 |
| Fast-food outlets | 4.70*** | 0.03 | 4.61*** | 0.04 | 2.55** | 0.02 | 3.11** | 0.02 | 0.70 | 0.00 |
| Cigarette retailers | -11.95 | 0.01 | -5.44 | 0.00 | -7.59 | 0.01 | -7.17 | 0.01 | 2.95 | 0.00 |
| Park area | -0.02 | 0.01 | -0.02 | 0.01 | -0.02 | 0.01 | -0.02 | 0.01 | -0.01 | 0.01 |
| Hospital beds | 0.00 | 0.00 | -0.08** | 0.02 | -0.04 | 0.01 | 0.03 | 0.00 | -0.02 | 0.01 |
| Health check-ups | 0.01 | 0.00 | 0.04 | 0.00 | 0.10* | 0.02 | 0.08** | 0.02 | -0.02 | 0.00 |
| Unmet medical need | 0.00 | 0.00 | 0.04 | 0.00 | 0.00 | 0.00 | 0.03 | 0.00 | 0.04 | 0.01 |
| Women | - | 0.16 | - | 0.18 | - | 0.12 | - | 0.17 | - | 0.26 |
| Community socioeconomic factors | - | 0.04 | - | 0.06 | - | 0.03 | - | 0.03 | - | 0.05 |
| Living alone | 0.02 | 0.00 | 0.08*** | 0.03 | 0.03 | 0.00 | 0.03 | 0.00 | 0.03 | 0.01 |
| Recipient of basic support | -0.06 | 0.00 | 0.06 | 0.00 | -0.05 | 0.00 | 0.04 | 0.00 | 0.01 | 0.00 |
| High income | 0.02 | 0.01 | -0.01 | 0.00 | 0.02 | 0.00 | 0.01 | 0.00 | 0.00 | 0.00 |
| High education | -0.07*** | 0.03 | -0.02 | 0.00 | -0.10** | 0.02 | -0.10** | 0.02 | -0.02 | 0.00 |
| Unemployment | 0.05 | 0.01 | 0.01 | 0.00 | -0.11 | 0.01 | -0.08 | 0.00 | 0.06** | 0.01 |
| Manual job | 0.01 | 0.00 | 0.01 | 0.00 | -0.08** | 0.02 | -0.01 | 0.00 | -0.01 | 0.00 |
| Community interpersonal factors | - | 0.00 | - | 0.00 | - | 0.00 | - | 0.01 | - | 0.04 |
| Religious activity | 0.00 | 0.00 | 0.00 | 0.00 | 0.01 | 0.00 | 0.05 | 0.01 | 0.04*** | 0.03 |
| Social activity | 0.00 | 0.00 | 0.02 | 0.00 | 0.01 | 0.00 | -0.03 | 0.00 | -0.03** | 0.02 |
| Community neighborhood factors | - | 0.09 | - | 0.09 | - | 0.09 | - | 0.13 | - | 0.11 |
| Pubs | 0.48*** | 0.03 | 0.26 | 0.01 | 0.30 | 0.01 | 0.18 | 0.00 | 0.06 | 0.01 |
| Fast-food outlets | 1.52 | 0.01 | 2.53*** | 0.03 | 2.74*** | 0.03 | 3.89*** | 0.05 | 0.77*** | 0.04 |
| Cigarette retailers | -2.05 | 0.00 | -6.95 | 0.01 | -1.27 | 0.00 | 5.88 | 0.00 | -0.93 | 0.00 |
| Park area | -0.02** | 0.02 | -0.02*** | 0.03 | -0.01 | 0.00 | -0.02** | 0.02 | 0.00 | 0.00 |
| Hospital beds | -0.05** | 0.02 | -0.03 | 0.01 | -0.05 | 0.01 | -0.07** | 0.02 | -0.01 | 0.01 |
| Health check-ups | 0.01 | 0.00 | 0.02 | 0.00 | 0.05 | 0.01 | 0.04 | 0.01 | -0.03 | 0.01 |
| Unmet medical need | 0.03 | 0.01 | -0.02 | 0.00 | 0.04 | 0.00 | -0.03 | 0.00 | -0.02 | 0.01 |
β, regression coefficient; R2, R-squared value.
1 Estimated from regression models including age-standardized rates of unhealthy living as the dependent variable and age-standardized rates of covariates (except the densities of pubs, fast-food outlets, and cigarette retailers, as well as hospital beds per 1,000 people and park area per person, using crude estimates) as independent variables.
** p<0.01,
*** p<0.001.
- 1. Carey RM, Muntner P, Bosworth HB, Whelton PK. Prevention and control of hypertension: JACC health promotion series. J Am Coll Cardiol 2018;72:1278-1293 https://doi.org/10.1016/j.jacc.2018.07.008.ArticlePubMedPMC
- 2. Pirani N, Khiavi FF. Population attributable fraction for cardiovascular diseases risk factors in selected countries: a comparative study. Mater Sociomed 2017;29:35-39 https://doi.org/10.5455/msm.2017.29.35-39.ArticlePubMedPMC
- 3. World Health Organization. Global action plan for the prevention and control of noncommunicable diseases 2013-2020; 2013 [cited 2023 Aug 24]. Available from: https://www.who.int/southeastasia/publications-detail/9789241506236.
- 4. GBD 2017 Risk Factor Collaborators. Global, regional, and national comparative risk assessment of 84 behavioural, environmental and occupational, and metabolic risks or clusters of risks for 195 countries and territories, 1990-2017: a systematic analysis for the Global Burden of Disease Study 2017. Lancet 2018;392:1923-1994 https://doi.org/10.1016/S0140-6736(18)32225-6.ArticlePubMedPMC
- 5. Pholpark A, Shin HR, Aekplakorn W. Association between behavioral risk factors and self-rated health: data from national health surveys in South Korea and Thailand. Health Soc Welf Rev 2017;37:498-524 https://doi.org/10.15709/hswr.2017.37.2.498.Article
- 6. Park EJ, Jun J, Kim NS. The association of multiple risky health behaviors with self-reported poor health, stress, and depressive symptom. Health Soc Welf Rev 2015;35:136-157 (Korean). https://doi.org/10.15709/hswr.2015.35.1.136.Article
- 7. Schuit AJ, van Loon AJ, Tijhuis M, Ocké M. Clustering of lifestyle risk factors in a general adult population. Prev Med 2002;35:219-224 https://doi.org/10.1006/pmed.2002.1064.ArticlePubMed
- 8. Meader N, King K, Moe-Byrne T, Wright K, Graham H, Petticrew M, et al. A systematic review on the clustering and co-occurrence of multiple risk behaviours. BMC Public Health 2016;16:657 https://doi.org/10.1186/s12889-016-3373-6.ArticlePubMedPMC
- 9. Jeong JY, Kim C, Shin M, Ryu SY, Hong J, Kim NH, et al. Factors related with regional variations of health behaviors and health status: based on community health survey and regional characteristics data. Korean Public Health Res 2017;43:91-108 (Korean). https://doi.org/10.22900/kphr.2017.43.3.008.Article
- 10. Choi J, Yun EK, Byun HM. Identifying patterns of lifestyle behaviours linked to sociodemographic characteristics and health conditions among young adults in South Korea. J Adv Nurs 2023;79:2348-2359 doi: https://doi.org/10.1111/jan.15589.ArticlePubMed
- 11. Ryu SY, Park J, Choi SW, Han MA. Associations between sociodemographic characteristics and healthy lifestyles in Korean adults: the result of the 2010 Community Health Survey. J Prev Med Public Health 2014;47:113-123 https://doi.org/10.3961/jpmph.2014.47.2.113.ArticlePubMedPMC
- 12. Seo AR, Park KS. Residential characteristics as factors related to healthy behavior practices-decision tree model analysis using a Community Health Survey from Korea. Int J Environ Res Public Health 2022;19:7390 https://doi.org/10.3390/ijerph19127390.ArticlePubMedPMC
- 13. Mollborn S, Lawrence EM, Hummer RA. A gender framework for understanding health lifestyles. Soc Sci Med 2020;265:113182 https://doi.org/10.1016/j.socscimed.2020.113182.ArticlePubMedPMC
- 14. Jeon YJ, Pyo J, Park YK, Ock M. Health behaviors in major chronic diseases patients: trends and regional variations analysis, 2008-2017, Korea. BMC Public Health 2020;20:1813 https://doi.org/10.1186/s12889-020-09940-7.ArticlePubMedPMC
- 15. Jeong CR, Kim JM, Park CY, Shin E, Tchoe B. Determinants of healthy living practice: county approach. Health Policy Manag 2020;30:376-385 (Korean). https://doi.org/10.4332/KJHPA.2020.30.3.376.Article
- 16. Jang BN, Kim HJ, Kim BR, Woo S, Lee WJ, Park EC. Effect of practicing health behaviors on unmet needs among patients with chronic diseases: a longitudinal study. Int J Environ Res Public Health 2021;18:7977 https://doi.org/10.3390/ijerph18157977.ArticlePubMedPMC
- 17. Korea Health Promotion Institute. Health Plan 2020; 2015 [cited 2022 Nov 24]. Available from: https://www.khepi.or.kr/board/view?pageNum=1&rowCnt=10&menuId=MENU00829&maxIndex=99999999999999&minIndex=99999999999999&schType=0&schText=&categoryId=&continent=&country=&upDown=0&boardStyle=&no1=0&linkId=559210 (Korean).
- 18. Barbaresko J, Rienks J, Nöthlings U. Lifestyle indices and cardiovascular disease risk: a meta-analysis. Am J Prev Med 2018;55:555-564 https://doi.org/10.1016/j.amepre.2018.04.046.ArticlePubMed
- 19. Kang YW, Ko YS, Kim YJ, Sung KM, Kim HJ, Choi HY, et al. Korea community health survey data profiles. Osong Public Health Res Perspect 2015;6:211-217 doi: https://doi.org/10.1016/j.phrp.2015.05.003.ArticlePubMedPMC
- 20. Kim I, Bahk J, Yoon TH, Yun SC, Khang YH. Income differences in smoking prevalences in 245 districts of South Korea: patterns by area deprivation and urbanity, 2008-2014. J Prev Med Public Health 2017;50:100-126 https://doi.org/10.3961/jpmph.16.069.ArticlePubMedPMC
- 21. Kim E, Choo I, Noh Y. Factors influencing the practice of healthy living as an integrated indicator of the elderly’s drinking, smoking, and walking patterns: using Korea Community Health Surveys. Int J Environ Res Public Health 2022;19:1936 https://doi.org/10.3390/ijerph19041936.ArticlePubMedPMC
- 22. Wu S, An S, Li W, Lichtenstein AH, Gao J, Kris-Etherton PM, et al. Association of trajectory of cardiovascular health score and incident cardiovascular disease. JAMA Netw Open 2019;2:e194758. https://doi.org/10.1001/jamanetworkopen.2019.4758.ArticlePubMedPMC
- 23. World Health Organization. International guide for monitoring alcohol consumption and related harm; 2002 [cited 2023 Aug 30]. Available from: https://www.who.int/publications/i/item/international-guide-for-monitoring-alcohol-consumption-and-related-harm.
- 24. Yoo JI, Ha YC, Lee YK, Yoo MJ, Koo KH. High prevalence of sarcopenia among binge drinking elderly women: a nationwide population-based study. BMC Geriatr 2017;17:114 https://doi.org/10.1186/s12877-017-0507-3.ArticlePubMedPMC
- 25. Ha S, Choi HR, Lee YH. Clustering of four major lifestyle risk factors among Korean adults with metabolic syndrome. PLoS One 2017;12:e0174567. https://doi.org/10.1371/journal.pone.0174567.ArticlePubMedPMC
- 26. Kim S, Byun G, Jo G, Park D, Cho SI, Oh H, et al. Gender and tobacco epidemic in South Korea: implications from age-periodcohort analysis and the DPSEEA framework. BMJ Open 2022;12:e058903. https://doi.org/10.1136/bmjopen-2021-058903.ArticlePubMedPMC
- 27. Sørensen M, Gill DL. Perceived barriers to physical activity across Norwegian adult age groups, gender and stages of change. Scand J Med Sci Sports 2008;18:651-663 https://doi.org/10.1111/j.1600-0838.2007.00686.x.ArticlePubMed
- 28. Nam GE, Kim YH, Han K, Jung JH, Rhee EJ, Lee WY, et al. Obesity fact sheet in Korea, 2020: prevalence of obesity by obesity class from 2009 to 2018. J Obes Metab Syndr 2021;30:141-148 https://doi.org/10.7570/jomes21056.ArticlePubMedPMC
- 29. Villiers-Tuthill A, Copley A, McGee H, Morgan K. The relationship of tobacco and alcohol use with ageing self-perceptions in older people in Ireland. BMC Public Health 2016;16:627 https://doi.org/10.1186/s12889-016-3158-y.ArticlePubMedPMC
- 30. Viinikainen J, Bryson A, Böckerman P, Kari JT, Lehtimäki T, Raitakari O, et al. Does better education mitigate risky health behavior? A mendelian randomization study. Econ Hum Biol 2022;46:101134 https://doi.org/10.1016/j.ehb.2022.101134.ArticlePubMed
- 31. Pampel FC, Krueger PM, Denney JT. Socioeconomic disparities in health behaviors. Annu Rev Sociol 2010;36:349-370 https://doi.org/10.1146/annurev.soc.012809.102529.ArticlePubMedPMC
- 32. Lee Y. Slender women and overweight men: gender differences in the educational gradient in body weight in South Korea. Int J Equity Health 2017;16:202 https://doi.org/10.1186/s12939-017-0685-9.ArticlePubMedPMC
- 33. Tay L, Tan K, Diener E, Gonzalez E. Social relations, health behaviors, and health outcomes: a survey and synthesis. Appl Psychol Health Well Being 2013;5:28-78 https://doi.org/10.1111/aphw.12000.ArticlePubMed
- 34. Dury S, Stas L, Switsers L, Duppen D, Domènech-Abella J, Dierckx E, et al. Gender-related differences in the relationship between social and activity participation and health and subjective well-being in later life. Soc Sci Med 2021;270:113668 https://doi.org/10.1016/j.socscimed.2020.113668.ArticlePubMed
- 35. Roh HW, Hong CH, Lee Y, Oh BH, Lee KS, Chang KJ, et al. Participation in physical, social, and religious activity and risk of depression in the elderly: a community-based three-year longitudinal study in Korea. PLoS One 2015;10:e0132838. https://doi.org/10.1371/journal.pone.0132838.ArticlePubMedPMC
- 36. Cline KM, Ferraro KF. Does religion increase the prevalence and incidence of obesity in adulthood? J Sci Study Relig 2006;45:269-281 https://doi.org/10.1111/j.1468-5906.2006.00305.x.ArticlePubMedPMC
- 37. Salmoirago-Blotcher E, Fitchett G, Ockene JK, Schnall E, Crawford S, Granek I, et al. Religion and healthy lifestyle behaviors among postmenopausal women: the women’s health initiative. J Behav Med 2011;34:360-371 https://doi.org/10.1007/s10865-011-9322-z.ArticlePubMed
- 38. Su JG, Dadvand P, Nieuwenhuijsen MJ, Bartoll X, Jerrett M. Associations of green space metrics with health and behavior outcomes at different buffer sizes and remote sensing sensor resolutions. Environ Int 2019;126:162-170 https://doi.org/10.1016/j.envint.2019.02.008.ArticlePubMed
- 39. Sun F, Norman IJ, While AE. Physical activity in older people: a systematic review. BMC Public Health 2013;13:449 https://doi.org/10.1186/1471-2458-13-449.ArticlePubMedPMC
- 40. World Health Organization Regional Office for the Western Pacific. Republic of Korea health system review; 2015 [cited 2023 Sep 1]. Available from: https://iris.who.int/bitstream/handle/10665/208215/9789290617105_eng.pdf?sequence=1.
- 41. Park SM, Hong SP. The association of health care access and utilization with self-perceived health in South Korea: the significance of age. J Biosoc Sci 2020;52:1-13 https://doi.org/10.1017/S0021932019000191.ArticlePubMed
- 42. Lim JH. Regional disparity and factors influencing unmet medical needs: a study based on the sixth Korea National Health and Nutrition Examination Survey (2015). Osong Public Health Res Perspect 2017;8:295-301 https://doi.org/10.24171/j.phrp.2017.8.5.02.ArticlePubMedPMC
- 43. Chun JD, Ryu SY, Han MA, Park J. Comparisons of health status and health behaviors among the elderly between urban and rural areas. J Agric Med Community Health 2013;38:182-194 (Korean). https://doi.org/10.5393/JAMCH.2013.38.3.182.Article
- 44. Park EJ, Kim H, Kawachi I, Kim IH, Cho SI. Area deprivation, individual socioeconomic position and smoking among women in South Korea. Tob Control 2010;19:383-390 https://doi.org/10.1136/tc.2009.032763.ArticlePubMed
- 45. Kong KA, Kim YE, Lim S, Kim BY, Kim GE, Kim SI. Depressive symptoms and suicidal ideation in individuals living alone in South Korea. Diagnostics (Basel) 2022;12:603 https://doi.org/10.3390/diagnostics12030603.ArticlePubMedPMC
- 46. Guan N, Guariglia A, Moore P, Xu F, Al-Janabi H. Financial stress and depression in adults: a systematic review. PLoS One 2022;17:e0264041. https://doi.org/10.1371/journal.pone.0264041.ArticlePubMedPMC
- 47. Wang Q, Shen JJ, Cochran C. Unemployment rate, smoking in China: are they related? Int J Environ Res Public Health 2016;13:113 https://doi.org/10.3390/ijerph13010113.ArticlePubMedPMC
- 48. Campbell CA, Hahn RA, Elder R, Brewer R, Chattopadhyay S, Fielding J, et al. The effectiveness of limiting alcohol outlet density as a means of reducing excessive alcohol consumption and alcohol-related harms. Am J Prev Med 2009;37:556-569 https://doi.org/10.1016/j.amepre.2009.09.028.ArticlePubMed
- 49. Katikireddi SV, Whitley E, Lewsey J, Gray L, Leyland AH. Socioeconomic status as an effect modifier of alcohol consumption and harm: analysis of linked cohort data. Lancet Public Health 2017;2:e267-e276 https://doi.org/10.1016/S2468-2667(17)30078-6.ArticlePubMedPMC
- 50. van Erpecum CL, van Zon SK, Bültmann U, Smidt N. The association between fast-food outlet proximity and density and body mass index: findings from 147,027 Lifelines Cohort Study participants. Prev Med 2022;155:106915 https://doi.org/10.1016/j.ypmed.2021.106915.ArticlePubMed
 PubReader
 ePub Link
 Cite
Cite