
Articles
- Page Path
- HOME > Epidemiol Health > Volume 44; 2022 > Article
-
COVID-19
Original Article
Effect of socioeconomic disparities on the risk of COVID-19 in 8 metropolitan cities in the Korea: a community-based study -
Myung-Jae Hwang1
 , Shin Young Park1, Tae-Ho Yoon2, Jinhwa Jang1, Seon-Young Lee1, Myeongsu Yoo1, Yoo-Yeon Kim1, Hae-Kwan Cheong3, Donghyok Kwon1, Jong-Hun Kim3
 -
Epidemiol Health 2022;44:e2022107.
DOI: https://doi.org/10.4178/epih.e2022107
Published online: November 15, 2022
1Division of Public Health Emergency Response Research, Korea Disease Control and Prevention Agency, Cheongju, Korea
2Department of Preventive Medicine, Pusan National University School of Medicine, Busan, Korea
3Department of Social and Preventive Medicine, Sungkyunkwan University School of Medicine, Suwon, Korea
- Correspondence: Jong-Hun Kim Department of Social and Preventive Medicine, Sungkyunkwan University School of Medicine, 2066 Seobu-ro, Jangan-gu, Suwon 16419, Korea E-mail: kimjh32@skku.edu
- Co-correspondence: Donghyok Kwon Division of Public Health Emergency Response Research, Korea Disease Control and Prevention Agency, 187 Osongsaengmyeong 2-ro, Heungdeok-gu, Cheongju 28159, Korea E-mail: vethyok@korea.kr
© 2022, Korean Society of Epidemiology
This is an open-access article distributed under the terms of the Creative Commons Attribution License (http://creativecommons.org/licenses/by/4.0/), which permits unrestricted use, distribution, and reproduction in any medium, provided the original work is properly cited.
Abstract
-
OBJECTIVES
- Socioeconomic disparities have been reported as major risk factors contributing to the spread of coronavirus disease 2019 (COVID-19) at the community level. We conducted an epidemiological study on COVID-19 incidence risk using area-based deprivation indices (DIs) reflecting the characteristics of the susceptible population.
-
METHODS
- A database of the confirmed COVID-19 cases in 8 metropolitan cities in Korea from January 20, 2020 to December 31, 2021 was combined with area-based DI scores and standardized prevalence rates of diabetes and hypertension from the Korean Community Health Survey. Relative risk (RR) levels were estimated using a generalized linear model with a Poisson distribution by age group.
-
RESULTS
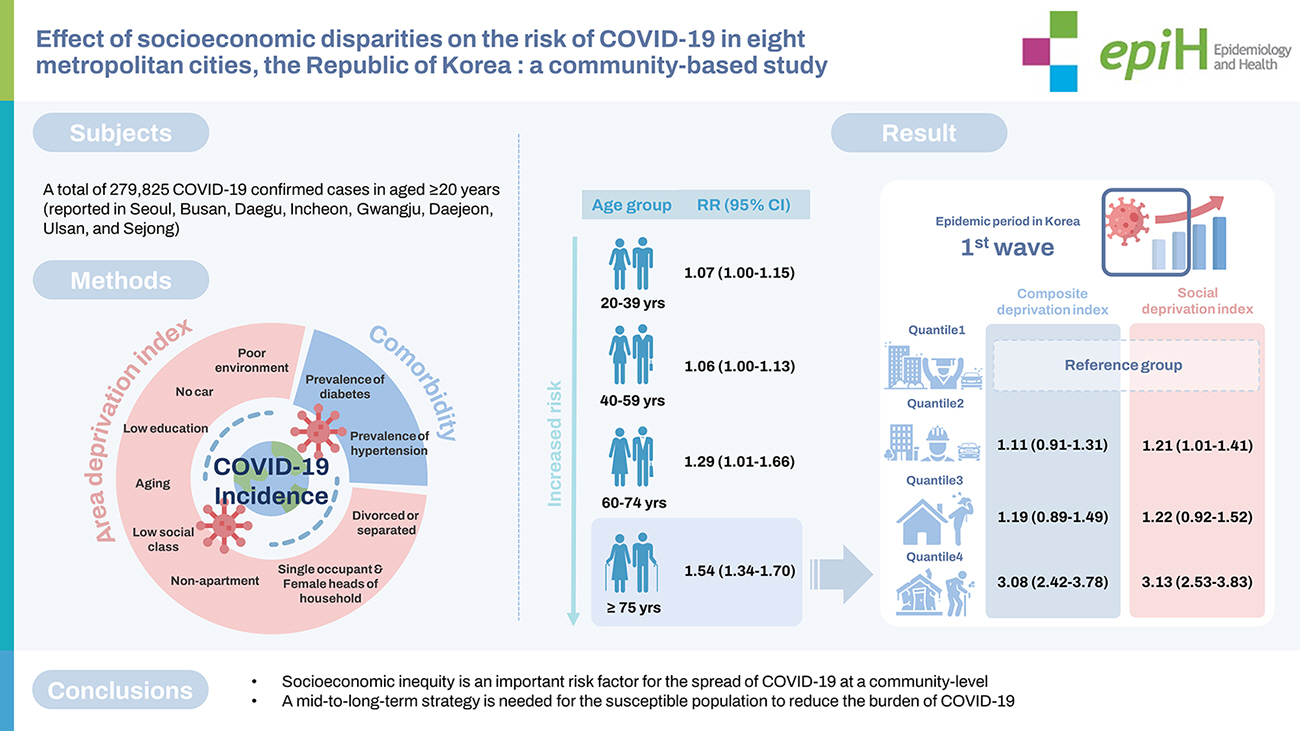
- The risk of COVID-19 incidence generally increased with increasing age, especially in patients aged ≥75 years. The RR of COVID-19 incidence per interquartile range increment of the composite deprivation index (composite DI) was 1.54 (95% confidence interval [CI], 1.34 to 1.70). Notably, in the first wave, the risk of COVID-19 incidence was approximately 3 times higher in the region with the lowest socioeconomic status than in the region with the highest status (RR, 3.08; 95% CI, 2.42 to 3.78 based on the the composite DI and RR, 3.13; 95% CI, 2.53 to 3.83 based on the social deprivation index).
-
CONCLUSIONS
- This study provides scientific evidence that socioeconomic deprivation is an important risk factor for the spread of COVID-19. This finding suggests that a mid-term to long-term strategy is needed to protect susceptible populations and reduce the burden of COVID-19 in the community.
- Since the first patient with coronavirus disease 2019 (COVID-19) was confirmed in Korea on January 20, 2020, the number of cases has surpassed 10 million (as of April 2022), leading to a strong sense of crisis. To prevent the spread of COVID-19, governments have implemented guidelines such as hand washing, social distancing, and quarantine. However, reported difficulty exists in the practical application of these guidelines in residential areas with extremely poor living conditions [1]. In the early stages of the COVID-19 pandemic, the virus spread mainly in countries with high economic status, such as the United States, France, Spain, and Korea; thus, the government recommendations to control the spread of infection were predicated on the availability of basic infrastructure, such as sanitary and medical facilities. These guidelines were derived under the premise of the highest living standards [2], including claims made by international organizations [3]. Overcrowded neighborhoods, lack of drinkable water, poor sanitary conditions in the home, lack of awareness of the importance of personal hygiene, and insufficient vaccination were found to be among the key risk factors in the pandemic [4]. Daily workers with unstable economic lives can struggle to maintain a livelihood because of home quarantine; additionally, even if they stay at home, the lack of in-house sanitation facilities may leave them no choice but to use public facilities near their residences [2]. Additionally, people living in extremely poor housing conditions often have underlying or chronic diseases and limited access to medical facilities, leading to serious complications when infected with severe acute respiratory syndrome coronavirus 2 (SARS-CoV-2) [2]. Such health-related inequities may create disparities among regions at different socioeconomic levels within a country [5].
- As the COVID-19 pandemic continues worldwide, concerns are growing about areas with large populations, poor health, and low socioeconomic status. Overcrowded neighborhoods and residential environments, lack of basic living infrastructure, informal or irregular work, lack of housing stability, and the need to use public facilities hinder the practice of social distancing and basic hygiene, thus increasing the risk of the spread of COVID-19 [6-9]. However, setting practical policies for areas vulnerable to infection is challenging due to a lack of reliable data on the political, economic, and social contexts that characterize the specific environment of each region [1,2].
- Therefore, we examined the risk of COVID-19 incidence by regional-level socioeconomic deprivation and presented scientific evidence that can be used to establish a regional health plan as part of a mid-term to long-term strategy for epidemic control in 8 metropolitan cities in Korea.
INTRODUCTION
- Study participants
- This study was conducted based on the Korean national database of confirmed patients with COVID-19 reported through the integrated National Notifiable Disease Surveillance System in the epidemiological investigation conducted by the KDCA from January 20, 2020 to December 31, 2021. The participants in our study included those ≥ 20 years old who were reported in Seoul, Busan, Daegu, Incheon, Gwangju, Daejeon, Ulsan, and Sejong as cases of community infection (excluding patients infected abroad or reported in Gyeonggi-do, Gangwon-do, Chungcheongbuk-do, Chungcheongnam-do, Jeollabuk-do, Jeollanam-do, Gyeongsangbuk-do, Gyeongsangnam-do, and Jeju-do). During the study period, the total number of confirmed COVID-19 cases was 279,825.
- Data sources
- An area deprivation index (DI) is an indicator of regional health and socioeconomic inequality [10]. For the area DI analysis, we obtained a 10% sample of survey data from Statistics Korea in 2015. DIs were calculated by summing z-standardized scores to attain a population-weighted mean of 0 and a variance of 1. Individual area-based DIs were measured based on the proportions of poor residential environments, households with no car, low educational attainment, aging population, low social class, non-apartment households, single-occupant households, female heads of household, and divorced or separated people by city, county, or district (si-gun-gu) [10]. These variables are defined in Supplementary Material 1. After normality testing for these constituent indicators, if the normal distribution did not apply, factor analysis was performed through transformation [11]. We used the composite deprivation index (composite DI), economic deprivation index (economic DI), social deprivation index (social DI), and DI of factors related to mortality (mortality-related DI) as indices for socioeconomic disparities at the regional level in 2015.
- In this study, Korean Community Health Survey (CHS) data were used to assess health vulnerability at the community level. The CHS is a national survey of 253 administrative districts (si-gun-gu) comprising all residents aged ≥ 19 years, obtained through primary (sample location) and secondary (sample household) probability sampling [12]. We used the regional standardized prevalence rates of diabetes and hypertension from the 2020 CHS survey as indices of health vulnerability. Furthermore, data regarding the COVID-19 vaccination rate were obtained from the integrated system in an epidemiological investigation by the KDCA. Vaccination began in Korea in February 2021. Since the vaccination rate continues to change, we calculated the first, second, and third vaccination rates on November 1 and December 23, 2021, respectively, after the start of the third vaccination.
- Definitions of covariates
- The COVID-19 incidence per 100,000 population was calculated based on the resident registration population status data provided by the Ministry of Public Administration and Security as of December 2020. The fatality rate was calculated as the number of COVID-19 deaths divided by the number of confirmed cases, multiplied by 100. The COVID-19 incidence and fatality rates were estimated by region at the si-gun-gu level.
- In this study, we used the composite area DI for Korea [10]. The composite DI was calculated using the following indicators: poor residential environments, no-car households, low educational attainment, aging population, low social class, non-apartment households, single-occupant households, female heads of household, and divorced or separated people. The economic DI was calculated based on rates of non-apartment households, poor residential environments, low educational attainment, aging population, and low social class. The social DI was calculated based on rates of single-occupant households, no-car households, nonapartment households, female heads of household, and divorced or separated people. The mortality-related DI was calculated using the indicators most strongly correlated with mortality: no-car households, low educational attainment, low social class, and divorced or separated people. These indicators were selected based on significant results from factor analysis, and the DI was calculated as the sum of the standardized scores [11]. Generally, a high value indicates an area with a large proportion of aging population, low educational attainment, and poor residential environments, whereas a lower value indicates the opposite [10].
- Indices of the regional prevalence levels of diabetes and hypertension were defined as the standardized prevalence of participants aged > 19 years diagnosed with the disease by a doctor. Furthermore, age standardization was applied for comparison with indicators surveyed in other regions or at other time points, as the age-specific population structure that impacts health status differs depending on the survey region and time point [12].
- We associated the COVID-19 incidence and fatality rates reported by si-gun-gu with scores on several area-based DIs (composite DI, economic DI, social DI, and mortality-related DI) as well as the standardized prevalence rates of diabetes and hypertension.
- Study design
- We calculated the risks of COVID-19 incidence and fatality according to the regional-level area-based DIs throughout the study period. Then, we estimated the risk by age group, with participants divided into those aged 20-39 years, 40-59 years, 60-74 years, and ≥ 75 years. The COVID-19 incidence risk was evaluated for each epidemic period, divided into the first wave (from February 18 to May 5, 2020), the second wave (from August 12 to November 12, 2020), the third wave (from November 13, 2020 to January 20, 2021), and the fourth wave (from July 7 to December 31, 2021) in Korea. In patients aged ≥ 75 years, the risk of COVID-19 incidence was estimated for the 4 quantiles of the composite DI and the social DI for each epidemic period. For composite DI, quantile 1 (Q1, reference) included areas with scores less than -7.9, quantile 2 (Q2) included those with scores greater than -7.9 and less than -4.8, quantile 3 (Q3) represented scores greater than -4.8 and less than -2.1, and quantile 4 (Q4) represented scores of 2.1 or more. As for social DI, Q1 (reference) included regions with scores less than -3.7, Q2 included those with scores greater than -3.7 and less than -1.3, Q3 represented scores greater than -1.3 and less than 1.3, and Q4 represented scores ≥ 1.3. Additionally, we analyzed the rate of SARS-CoV-2 vaccination by quantile of the composite DI at the regional level.
- Statistical analysis
- We carried out a retrospective cohort study using a generalized linear model with a Poisson distribution to observe the risk of SARS-CoV-2 infection per interquartile range (IQR) increment of each area-based DI, adjusting for the standardized prevalence levels of diabetes and hypertension. To determine the optimal model, the Akaike criterion was calculated for each model (Supplementary Material 2). All statistical analyses were performed using R version 4.0.4 (R Foundation for Statistical Computing, Vienna, Austria) software.
- Ethics statement
- This study was approved by the Institutional Review Board of the Korea Disease Control and Prevention Agency (KDCA; approval No. KDCA 2021-04–07-PE-A). The board waived the requirement to obtain informed consent.
MATERIALS AND METHODS
- The confirmed COVID-19 cases included 139,585 males and 140,240 females, for a total of 279,825 cases (Table 1). These were divided into age groups, with 97,513 (34.8%) aged 20-39 years, 96,431 (34.5%) aged 40-59 years, 66,586 (23.8%) aged 60-74 years, and 19,295 (6.9%) aged ≥ 75 years. Based on the regional distribution, the number of confirmed cases reported in Seoul was 67.5%, accounting for more than half of the total cases. During the study period, 3,289 people died due to COVID-19, with a fatality rate of 1.2%.
- After calculating the area-based DI scores, the mean composite DI was determined to be -4.7. The highest composite DI was in Jung-gu (6.5), Busan and the lowest in Yuseong-gu (-13.9), Daejeon. The mean economic DI was -3.6, with the highest in Ganghwa-gun (4.2), Incheon and the lowest in Gangnam-gu (-9.7), Seoul. The mean social DI was -1.1, with the highest in Jung-gu (8.7), Busan and the lowest in Buk-gu (-11.1), Ulsan. The mean mortality-related DI was -1.9, with the highest in Jung-gu (3.0), Busan and the lowest in Seocho-gu (-8.5), Seoul. The mean standardized diabetes prevalence rate was 8.2%, with the highest prevalence in Jungnang-gu (11.3%), Seoul and the lowest in Yuseonggu (5.5%), Daejeon (Table 2). Finally, the mean standardized hypertension prevalence rate was 18.6%, with the highest prevalence in Jung-gu (23.9%), Incheon and the lowest in Nam-gu (14.8%), Gwangju.
- The COVID-19 incidence rate was calculated based on age group and epidemic period (Figure 1). During the study period, the total incidence per 100,000 population was 1,459.6 among all participants and 1,701.0, 1,522.2, 1,331.9, and 1,302.7 among those aged 60-74 years, 20-39 years, ≥ 75 years, and 40-59 years, respectively. The COVID-19 incidence rates per 100,000 population in the first, second, third, and fourth waves were 42.7 (with the highest incidence in the age group of 20-39 years), 47.7 (with the highest incidence in the age group of 60-74 years), 148.3 (with the highest incidence in the age group of ≥ 75 years), and 1,285.0 (with the highest incidence in the age group of 60-74 years), respectively. This result was supported by clear variation in the COVID-19 outbreak pattern and age group of spread by epidemic period. The COVID-19 incidence rates at the si-gun-gu level during the study period and each epidemic period are shown in Supplementary Material 3.
- Based on generalized linear modeling of the risk of COVID-19 incidence associated with the area-based DIs, a statistically significant result was observed in model 3, which was the optimal model in our study (Table 3). A strong correlation was noted between the risk of COVID-19 incidence and the composite DI. The relative risk (RR) per IQR increment was higher for the composite DI (1.44; 95% confidence interval [CI],1.35 to 1.57) than for the other area-based DIs. Furthermore, the RRs per IQR increment for the economic DI (1.05; 95% CI, 1.02 to 1.07) and the social DI (1.10; 95% CI, 1.01 to 1.19) constituted significant findings. However, the RR per IQR increment for mortality-related DI (0.97; 95% CI, 0.90 to 1.04) did not constitute a significant result.
- Overall, the association between the risk of COVID-19 incidence and the IQR increment of the area-based DIs varied significantly by age group (excluding mortality-related DI), with the strongest relationship found among those aged ≥ 75 years (Table 4). In that age group, the RR of incidence per IQR increment was 1.54 (95% CI, 1.34 to 1.70) for the composite DI, 1.06 (95% CI, 1.02 to 1.10) for the economic DI, and 1.21 (95% CI, 1.16 to 1.27) for the social DI.
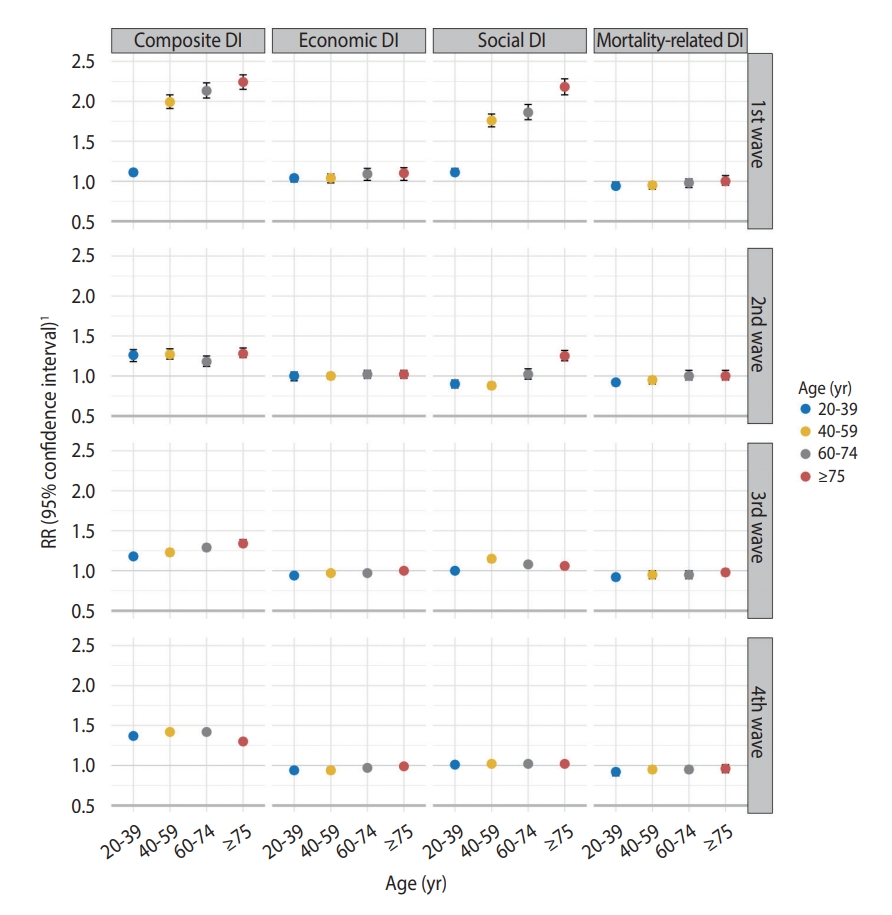
- Based on these results, the risk of SARS-CoV-2 infection by age group was analyzed according to the epidemic period (Figure 2). Here, the relationship between COVID-19 risk and area-based DI score also strengthened with increasing age. This effect was most conspicuous during the first wave, with an obvious pattern. In the first wave, the RRs per IQR increment for composite DI and social DI were 2.24 (95% CI, 2.15 to 2.33) and 2.18 (95% CI, 2.08 to 2.28), respectively, in patients aged ≥ 75 years. In the second wave, the RRs per IQR increment for composite DI and social DI were 1.28 (95% CI, 1.23 to 1.35) and 1.25 (95% CI, 1.19 to 1.32), respectively, in that age group. During the third wave of the epidemic, this pattern showed similar results for composite DI. In the third wave, the RR per IQR increment for composite DI was 1.34 (95% CI, 1.30 to 1.39) for those aged ≥ 75 years, among whom it was highest; however, consistent results were not observed during the fourth wave. Moreover, no significant relationship with COVID-19 incidence according to age group was found for economic DI or mortality-related DI.
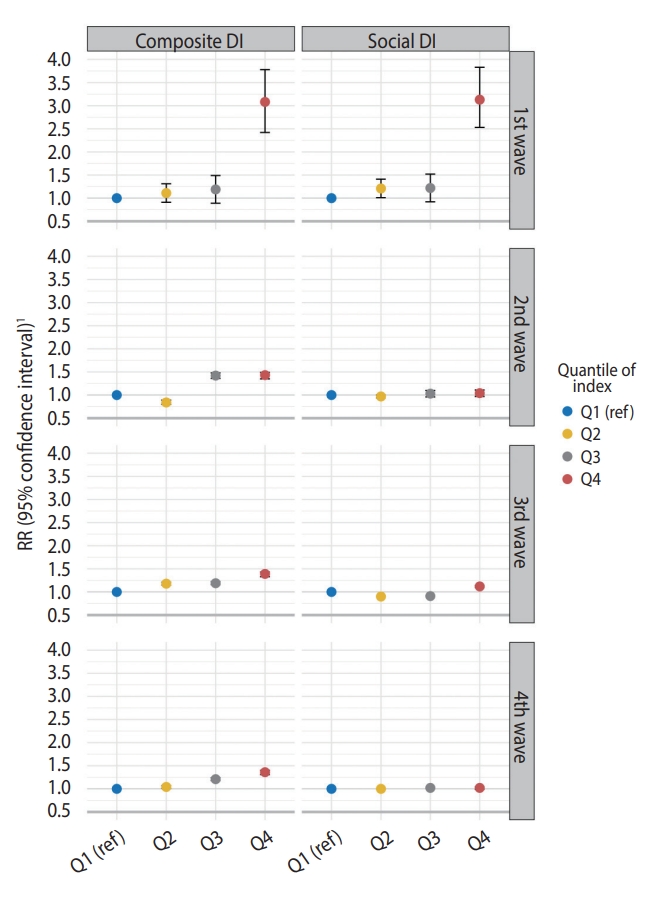
- Based on previous results, the risk of COVID-19 incidence was estimated by dividing the composite DI and social DI scores into quartiles by region in patients aged ≥ 75 years, which showed significant results (Figure 3). As the quantiles of composite DI and social DI increased, the risk of COVID-19 increased. During the first wave, the COVID-19 risk for the areas in Q4 by the composite DI was 3.08 (95% CI, 2.42 to 3.78) and the risk for those in Q4 by the social DI was 3.13 (95% CI, 2.53 to 3.83) times higher than the risk in the Q1 areas for the respective measure. In the areas in Q4 of the composite DI, the RRs for the second, third, and fourth waves were 1.43 (95% CI, 1.35 to 1.49), 1.39 (95% CI, 1.33 to 1.43), and 1.36 (95% CI, 1.31 to 1.40), respectively. In contrast, considering social DI quantiles, the relationship with COVID-19 risk was significant in only the first (3.13; 95% CI, 2.53 to 3.83).and third waves (1.12; 95% CI, 1.10 to 1.14).
RESULTS
- We explored the effects of socioeconomic disparities on the risk of COVID-19 at the regional level. Our findings indicated that the risk of COVID-19 incidence and fatality increased with regional socioeconomic deprivation (Supplementary Material 4). Furthermore, greater sensitivity to this relationship was observed among patients aged ≥ 75 years. Additionally, a greater risk of COVID-19 was reported in areas with higher quantiles of composite DI and social DI. To our knowledge, based on the determinants of the spread of infection in each area, the COVID-19 risk level differed according to the epidemic period. The pattern of increased COVID-19 incidence risk with an increasing level of socioeconomic deprivation was most prominent during the early stages of the COVID-19 epidemic (i.e., the first and second waves) in Korea. This is attributable to the lack of information and awareness regarding the risk and prevention of SARS-CoV-2 infection in the early stages of the epidemic. In particular, the risk would be expected to be higher in the older population, who may have limited access to information from the media. Low socioeconomic levels, poor access to health care, and occupational and environmental factors may also increase potential exposure to viruses at the community level [2,4]. Thus, we observed that these socioeconomic factors may serve as determinants for the transmission of infectious diseases.
- An area-based DI is a representative indicator of health determinants, such as poor residential environment, public health susceptibility, and poor access to sanitation and health facilities at the community level [12]. People living in poor housing conditions can experience serious complications when infected due to difficulty receiving timely and appropriate medical services, leading to a high fatality rate [13]. Moreover, the potentially fatal risk of spreading infectious diseases, such as COVID-19, in low-income areas can generate socioeconomic inconsistencies due to preventive measures and variations in health behavior [14]. Specifically, populations in more socioeconomically deprived areas have a higher risk of infection due to a lack of prior knowledge and prevention of infectious diseases such as COVID-19. The Korean CHS conducted for 2020, when the epidemic began, revealed lower compliance with safety and quarantine rules for the prevention of infectious diseases among those with lower education or income levels [15]. Furthermore, the implementation of preventive measures and quarantine rules differed according to the relative level of inequality [15]. A cohort study based on the Korean National Health Insurance database revealed that the risk of SARS-CoV-2 infection was 22% higher among Medical Aid beneficiaries than others [16].
- Additionally, regional socioeconomic disparities have been reported as a determinant of the spread of SARS-CoV-2 infection [17]. KC et al. [18] reported that the risk of COVID-19 was nearly 40% higher in the quantile with the lowest neighborhood socioeconomic status than in that with the highest status, underscoring the association between socioeconomic status and access to healthcare services. In a similar study, for 7 states in the United States (Arizona, Florida, Illinois, Maryland, North Carolina, South Carolina, and Virginia), a strong relationship was reported between a composite area DI and COVID-19 incidence [19]. A comparison by income in the New York metropolitan area revealed that the infection rate was lower in zip codes with higher income levels [20]. Moreover, socioeconomically disadvantaged people have been shown to have an increased risk of COVID-19 mortality, with a mortality rate 3.2 times higher in migrants than in general populations [2]. Our study results were consistent with those of previous studies.
- These socioeconomic disparities between regions were associated with the prevalence rates of diabetes and hypertension, which are common chronic diseases [21]. Such gaps are a likely contributor to regional health inequality. In our study, similar to previous studies, an analysis of the risk of COVID-19 incidence and fatality according to the regional standardized prevalence of diabetes and hypertension showed that the risk of infection increased with increasing morbidity [22,23]. Furthermore, the observed COVID-19 risk among patients with diabetes and hypertension is likely multifactorial. According to previous reports, diabetes may promote the entry of SARS-CoV-2 via the increased expression of angiotensin-converting enzyme 2 surface receptors, due both to the disease itself and the therapeutic strategies used. Moreover, cytokine storms and end-organ damage may be major contributors to this risk due to the underlying immune dysregulation, which can tend to promote exaggerated immune responses to viral exposure in patients with hypertension [24,25]. Hence, in the present study, we estimated the risk of COVID-19 incidence by adjusting for the regional prevalence of diabetes and hypertension in 2020, when the epidemic started, and epidemiologically demonstrated the risk of COVID-19. We also observed that the risk of COVID-19 incidence is significantly associated with the regional level of diabetes and hypertension (Supplementary Materials 5 and 6).
- However, our study had some limitations. First, COVID-19 incidence was estimated based on the reported address of the reporting medical institution, not the residential address of the patient. Epidemiological information on COVID-19 is entered into the National Notifiable Disease Surveillance System by the KDCA, and the residential addresses of confirmed patients are self-reported, thus leading to missing data in the national database. As such, if SARS-CoV-2 infection testing is performed somewhere other than the patient’s region of residence, a bias may be present between the residential and reported addresses. Second, the study was conducted only in metropolitan cities and not in all regions of the Korea. In rural areas with a low population density, the incidence of SARS-CoV-2 infection was low during the study period and showed no clear relationship with socioeconomic DIs. As such, although not nationwide, a significant difference in risk level was observed according to regional socioeconomic disparities within large cities [19]. Although this has the advantage of reducing the variation in population density, which is an important risk factor for infectious diseases (such as SARS-CoV-2) transmitted through contact with confirmed patients, limitations exist in generalizing the study results on a national level. Third, demographic characteristics such as sex, non-pharmacological interventions such as social distancing, and factors attributable to the risk of spreading infectious diseases, such as vaccination rate, were not considered [26]. Additionally, we observed the composite DI and COVID-19 vaccination rate at the regional level according to the timing of vaccination in Korea (Supplementary Materials 7 and 8). No significant difference in the COVID-19 vaccination rate was noted at each time point, with the vaccine being preferentially administered to essential medical personnel, those aged ≥ 75 years, and residents in the area with the highest quantile of the composite DI in 2021. Finally, given the use of the available area DI data from 2015, relatively recent information was not reflected in our study. The area DI is an indicator calculated once every 5 years. Hence, if our study had been conducted based on the 2020 area DI, we could have evaluated the risk of COVID-19 incidence more accurately by the level of health and the socioeconomic gap between regional levels.
- Despite these limitations, this study has the strength of evaluating the risk of COVID-19 incidence and fatality using area-based DIs at the si-gun-gu level in Korea. Additionally, the risk of incidence by age group was calculated according to the epidemic period, and the risk of SARS-CoV-2 infection was found to be higher in the more socioeconomically vulnerable population. Therefore, our study underscores the necessity of reducing the burden of COVID-19, identifying susceptible populations at the local level, establishing health improvement measures such as improving access to medical services, and achieving the effects of the guidelines recommended by the government. This suggests that socioeconomic support is needed for susceptible populations [2], such as the unemployed or extremely impoverished, who have trouble maintaining a stable livelihood, and that quarantine products should be distributed to those living in poor environments. Since accurate information is needed to prevent the spread of SARS-CoV-2 infection in advance, efforts should be made to deliver this information quickly and accurately to those with limited access to the media or news. Based on this study, with the ongoing spread of SARS-CoV-2 infection, each local government should implement continuous and appropriate preventive measures to support susceptible populations. We also suggest the need for a mid- to long-term strategy regarding socioeconomic inclusion.
- In conclusion, during the COVID-19 epidemic in Korea from 2020 to 2021, the risk of incidence increased as the level of socioeconomic deprivation in the area increased, especially among older adults. Based on the study results, we recommend the establishment of a mid- to long-term strategy for the sustained protection of susceptible populations in Korea, where the COVID-19 epidemic continues.
DISCUSSION
SUPPLEMENTARY MATERIALS
Supplementary Material 1.
Supplementary Material 2.
Supplementary Material 3.
Supplementary Material 4.
Supplementary Material 5.
Supplementary Material 6.
Supplementary Material 7.
Supplementary Material 8.
-
CONFLICT OF INTEREST
The authors have no conflicts of interest to declare for this study.
-
FUNDING
None.
-
AUTHOR CONTRIBUTIONS
Conceptualization: Hwang MJ, Park SY, Cheong HK, Lee SY, Kim JH. Data curation: Hwang MJ, Park SY, Jang J, Yoon TH, Kim JH. Formal analysis: Hwang MJ, Cheong HK, Kim JH. Funding acquisition: None. Methodology: Hwang MJ, Cheong HK. Project administration: Kwon D, Cheong HK, Yoon TH. Visualization: Hwang MJ, Cheong HK. Writing − original draft: Hwang MJ, Cheong HK, Kwon D, Yoon TH, Kim JH. Writing − review & editing: Hwang MJ, Park SY, Yoon TH, Jang J, Lee SY, Yoo M, Kim YY, Cheong HK, Kwon D, Kim JH.
NOTES
ACKNOWLEDGEMENTS

| Characteristics | Male | Female | Total | p-value1 | |
|---|---|---|---|---|---|
| Total | 139,585 (100) | 140,240 (100) | 279,825 (100) | <0.05 | |
| Age (yr) | <0.05 | ||||
| 20-39 | 51,588 (37.0) | 45,925 (32.7) | 97,513 (34.8) | ||
| 40-59 | 47,771 (34.1) | 48,660 (34.7) | 96,431 (34.5) | ||
| 60-74 | 32,054 (23.0) | 34,532 (24.6) | 66,586 (23.8) | ||
| ≥75 | 8,172 (5.9) | 11,123 (8.0) | 19,295 (6.9) | ||
| Administrativedistrict | <0.001 | ||||
| Seoul (25 districts) | 96,057 (68.8) | 92,839 (66.2) | 188,896 (67.5) | ||
| Busan (16 districts) | 9,622 (6.9) | 10,662 (7.6) | 20,284 (7.2) | ||
| Daegu (8 districts) | 8,628 (6.2) | 10,653 (7.6) | 19,281 (6.9) | ||
| Incheon (9 districts) | 14,363 (10.3) | 14,530 (10.4) | 28,893 (10.3) | ||
| Gwangju (5 districts) | 2,894 (2.1) | 3,335 (2.4) | 6,229 (2.2) | ||
| Daejeon (5 districts) | 4,533 (3.2) | 4,820 (3.4) | 9,353 (3.3) | ||
| Ulsan (5 districts) | 2,690 (1.9) | 2,715 (1.9) | 5,405 (2.0) | ||
| Sejong (1 district) | 798 (0.6) | 686 (0.5) | 1,484 (0.6) | ||
| Deaths (fatality) | 1,719 (1.2) | 1,570 (1.1) | 3,289 (1.2) | <0.05 | |
| Area deprivation index | Model 1 | Model 2 | Model 3 |
|---|---|---|---|
| Composite deprivation index | 1.40 (1.29, 1.54)* | 1.41 (1.30, 1.53)* | 1.44 (1.35, 1.57)* |
| Economic deprivation index | 1.00 (0.93, 1.08) | 1.02 (0.95, 1.11) | 1.05 (1.02, 1.07)* |
| Social deprivation index | 1.03 (0.98, 1.11) | 1.04 (1.03, 1.05)* | 1.10 (1.01, 1.19)* |
| Deprivation index of factors related to mortality | 0.95 (0.89, 1.02) | 0.97 (0.91, 1.03) | 0.97 (0.90, 1.04) |
| Area deprivation index |
Age (yr) |
|||
|---|---|---|---|---|
| 20-39 | 40-59 | 60-74 | ≥75 | |
| Composite deprivation index | 1.07 (1.00, 1.15) | 1.06 (1.00, 1.13) | 1.29 (1.01, 1.66)* | 1.54 (1.34, 1.70)* |
| Economic deprivation index | 0.97 (0.94, 1.00) | 0.97 (0.94, 1.01) | 1.00 (0.98, 1.04) | 1.06 (1.02, 1.10)* |
| Social deprivation index | 0.97 (0.94, 1.00) | 0.98 (0.96, 1.03) | 1.11 (1.05, 1.18)* | 1.21 (1.16, 1.27)* |
| Deprivation index of factors related to mortality | 0.94 (0.88, 0.99) | 0.95 (0.88, 0.99) | 1.00 (0.95, 1.03) | 1.00 (0.95, 1.07) |
- 1. Wilkinson A. Local response in health emergencies: key considerations for COVID-19 in informal urban settlements. Environ Urban 2020;32:503-522.PubMedPMC
- 2. Kim SJ. Rethinking intersectional approaches to vulnerability reduction and COVID19 risks in low-income communities. Sejong: Korea Research Institute for Human Settlements; 2020. (Korean).
- 3. Bhardwaj G, Esch T, Lall SV, Marconcini M, Soppelsa ME, Wahba Tadros SN. Cities, crowding, and the coronavirus: predicting contagion risk hotspots (English); 2020 [cited 2022 Mar 23]. Available from: http://documents.worldbank.org/curated/en/206541-587590439082/Cities-Crowding-and-the-Coronavirus-Predicting-Contagion-Risk-Hotspots.
- 4. Wasdani KP, Prasad A. The impossibility of social distancing among the urban poor: the case of an Indian slum in the times of COVID-19. Local Environ 2020;25:414-418.Article
- 5. Rostila M, Cederström A, Wallace M, Brandén M, Malmberg B, Andersson G. Disparities in coronavirus disease 2019 mortality by country of birth in Stockholm, Sweden: a total-population-based cohort study. Am J Epidemiol 2021;190:1510-1518.ArticlePubMedPMCPDF
- 6. Northridge ME, Sclar ED, Biswas P. Sorting out the connections between the built environment and health: a conceptual framework for navigating pathways and planning healthy cities. J Urban Health 2003;80:556-568.ArticlePubMedPMC
- 7. Nathan A, Villanueva K, Rozek J, Davern M, Gunn L, Trapp G, et al. The role of the built environment on health across the life course: a call for CollaborACTION. Am J Health Promot 2018;32:1460-1468.ArticlePubMedPDF
- 8. Algren MH, Bak CK, Berg-Beckhoff G, Andersen PT. Health-risk behaviour in deprived neighbourhoods compared with non-deprived neighbourhoods: a systematic literature review of quantitative observational studies. PLoS One 2015;10:e0139297.ArticlePubMedPMC
- 9. Jackson RJ. The impact of the built environment on health: an emerging field. Am J Public Health 2003;93:1382-1384.ArticlePubMedPMC
- 10. Lee SE, Yeon M, Kim CW, Yoon TH. The association among individual and contextual factors and unmet healthcare needs in South Korea: a multilevel study using national data. J Prev Med Public Health 2016;49:308-322.ArticlePubMedPMCPDF
- 11. Kim DJ, Lee SY, Myung G, Kim MH, Kim SS, Kim YM, et al. Developing health inequalities indicators and monitoring the status of health inequalities in Korea. Seoul: Korea Institution for Health and Social Affairs; 2013. p 286-298 (Korean).
- 12. Kim YT, Choi BY, Lee KO, Kim H, Chun JH, Kim SY, et al. Overview of Korean community health survey. J Korean Med Assoc 2012;55:74-83 (Korean).Article
- 13. Chetty R, Stepner M, Abraham S, Lin S, Scuderi B, Turner N, et al. The association between income and life expectancy in the United States, 2001-2014. JAMA 2016;315:1750-1766.ArticlePubMedPMC
- 14. Marmot M. Social determinants of health inequalities. Lancet 2005;365:1099-1104.ArticlePubMed
- 15. Lee GB, Jung SJ, Yiyi Y, Yang JW, Thang HM, Kim HC. Socioeconomic inequality in compliance with precautions and health behavior changes during the COVID-19 outbreak: an analysis of the Korean Community Health Survey 2020. Epidemiol Health 2022;44:e2022013.ArticlePubMedPMC
- 16. Jeong HE, Lee J, Shin HJ, Shin JY. Socioeconomic disparities in Korea by health insurance type during the COVID-19 pandemic: a nationwide study. Epidemiol Health 2021;43:e2021007.ArticlePubMedPMC
- 17. Lundon DJ, Mohamed N, Lantz A, Goltz HH, Kelly BD, Tewari AK. Social determinants predict outcomes in data from a multi-ethnic cohort of 20,899 patients investigated for COVID-19. Front Public Health 2020;8:571364.ArticlePubMedPMC
- 18. K C M, Oral E, Straif-Bourgeois S, Rung AL, Peters ES. The effect of area deprivation on COVID-19 risk in Louisiana. PLoS One 2020;15:e0243028.ArticlePubMedPMC
- 19. Hatef E, Chang HY, Kitchen C, Weiner JP, Kharrazi H. Assessing the impact of neighborhood socioeconomic characteristics on covid-19 prevalence across seven states in the United States. Front Public Health 2020;8:571808.ArticlePubMedPMC
- 20. Reichberg SB, Mitra PP, Haghamad A, Ramrattan G, Crawford JM; Northwell COVID-19 Research Consortium, et al. Rapid emergence of SARS-CoV-2 in the greater New York metropolitan area: geolocation, demographics, positivity rates, and hospitalization for 46 793 persons tested by Northwell Health. Clin Infect Dis 2020;71:3204-3213.ArticlePubMedPMCPDF
- 21. Dalstra JA, Kunst AE, Borrell C, Breeze E, Cambois E, Costa G, et al. Socioeconomic differences in the prevalence of common chronic diseases: an overview of eight European countries. Int J Epidemiol 2005;34:316-326.ArticlePubMed
- 22. Shah BR, Hux JE. Quantifying the risk of infectious diseases for people with diabetes. Diabetes Care 2003;26:510-513.ArticlePubMedPDF
- 23. Escobedo-de la Peña J, Rascón-Pacheco RA, de Jesús Ascencio-Montiel I, González-Figueroa E, Fernández-Gárate JE, Medina-Gómez OS, et al. Hypertension, diabetes and obesity, major risk factors for death in patients with COVID-19 in Mexico. Arch Med Res 2021;52:443-449.ArticlePubMed
- 24. Jeong IK, Yoon KH, Lee MK. Diabetes and COVID-19: global and regional perspectives. Diabetes Res Clin Pract 2020;166:108303.ArticlePubMedPMC
- 25. Barrera FJ, Shekhar S, Wurth R, Moreno-Pena PJ, Ponce OJ, Hajdenberg M, et al. Prevalence of diabetes and hypertension and their associated risks for poor outcomes in Covid-19 patients. J Endocr Soc 2020;4:bvaa102.ArticlePubMedPMCPDF
- 26. Doroshenko A. The combined effect of vaccination and nonpharmaceutical public health interventions-ending the COVID-19 pandemic. JAMA Netw Open 2021;4:e2111675.ArticlePubMed
REFERENCES
Figure & Data
References
Citations
- Association between area deprivation index and concerns to COVID-19: A multi-level analysis of individual and area factors
Doo Woong Lee, Jieun Jang, Jaeyong Shin
SSM - Population Health.2024; 25: 101580. CrossRef - The current state of graphical abstracts and how to create good graphical abstracts
Jieun Lee, Jeong-Ju Yoo
Science Editing.2023; 10(1): 19. CrossRef - Social deprivation and SARS-CoV-2 testing: a population-based analysis in a highly contrasted southern France region
Jordi Landier, Léa Bassez, Marc-Karim Bendiane, Pascal Chaud, Florian Franke, Steve Nauleau, Fabrice Danjou, Philippe Malfait, Stanislas Rebaudet, Jean Gaudart
Frontiers in Public Health.2023;[Epub] CrossRef
 PubReader
 ePub Link
 Cite
Cite


