Warning: fopen(/home/virtual/epih/journal/upload/ip_log/ip_log_2024-05.txt): failed to open stream: Permission denied in /home/virtual/lib/view_data.php on line 83 Warning: fwrite() expects parameter 1 to be resource, boolean given in /home/virtual/lib/view_data.php on line 84 The bounds of meta-analytics and an alternative method

The bounds of meta-analytics and an alternative method

Article information

Epidemiol Health. 2024;46.e2024016
Publication date (electronic) : 2024 January 7
doi : https://doi.org/10.4178/epih.e2024016
1School of Health Administration, Texas State University, San Marcos, TX, USA
2Meharry Medical College, School of Graduate Studies, Nashville, TN, USA
3Department of Epidemiology and Biostatistics, School of Medicine, The University of Texas at Tyler, Tyler, TX, USA
Correspondence: Karan P. Singh Department of Epidemiology and Biostatistics, School of Medicine, The University of Texas at Tyler, 11937 U.S. Highway 271, Tyler, TX 75708, USA E-mail: karan.singh@uttyler.edu
Received 2023 August 25; Revised 2023 December 19; Accepted 2023 December 25.

Abstract

OBJECTIVES

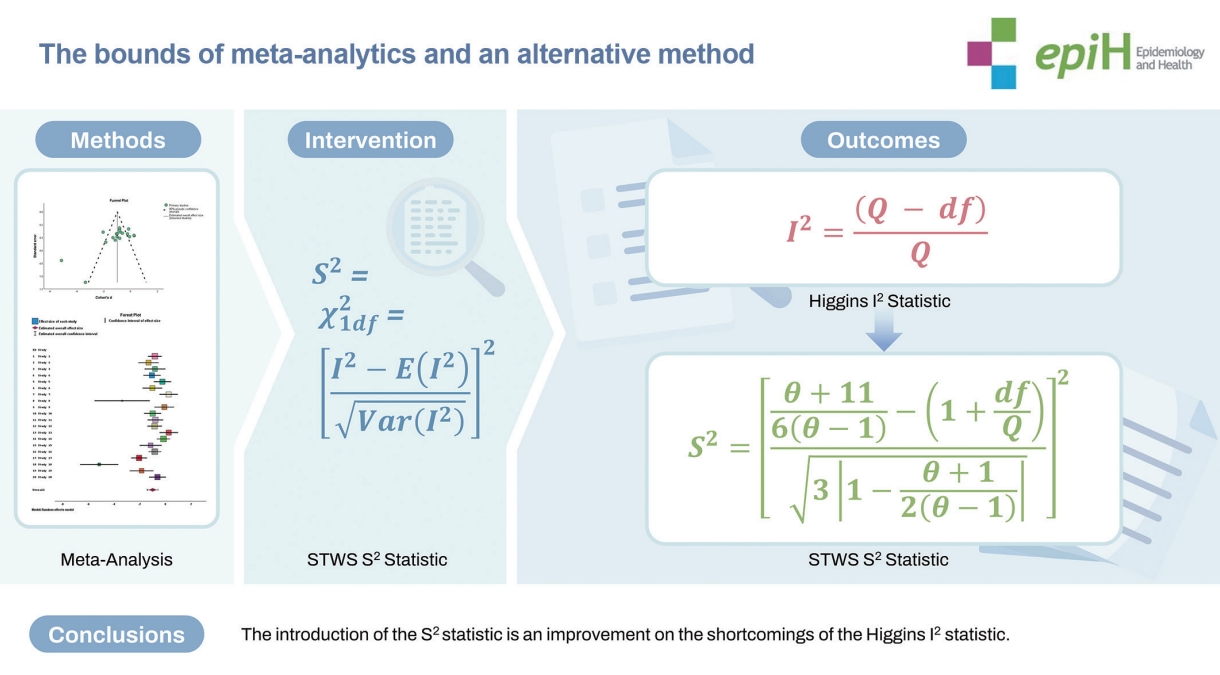
Meta-analysis is a statistical appraisal of the data analytic implications of published articles (Y), estimating parameters including the odds ratio and relative risk. This information is helpful for evaluating the significance of the findings. The Higgins I2 index is often used to measure heterogeneity among studies. The objectives of this article are to amend the Higgins I2 index score in a novel and innovative way and to make it more useful in practice.

METHODS

Heterogeneity among study populations can be affected by many sources, including the sample size and study design. They influence the Cochran Q score and, thus, the Higgins I2 score. In this regard, the I2 score is not an absolute indicator of heterogeneity. Q changes by bound as Y increases unboundedly. An innovative methodology is devised to show the conditional and unconditional probability structures.

RESULTS

Various properties are derived, including showing that a zero correlation between Q and Y does not necessarily mean that they are independent. A new alternative statistic, S2, is derived and applied to mild cognitive impairment and coronavirus disease 2019 vaccination for meta-analysis.

CONCLUSIONS

A hidden shortcoming of the Higgins I2 index is overcome in this article by amending the Higgins I2 score. The usefulness of the proposed methodology is illustrated using 2 examples. The findings have potential health policy implications.

GRAPHICAL ABSTRACT

Key Message

An approach to overcome the hidden shortcomings of Higgens I2 in meta-analysis. The approach has potential health policy implications.

INTRODUCTION

The genesis of meta-analysis can be traced to the work of an eminent statistician [1] who compared evidence from several studies on typhoid inoculation. Meta-analysis is intended to identify patterns of similarities and differences among studies with the same aim. Glass et al. [2] and others have discussed it in detail. Meta-analysis has been criticized for averaging the differences of studies with sample data from heterogeneous populations. A systematic review precedes the meta-analysis for the sake of appraising critical evidence in the publications. A meta-analysis is performed in sequential steps. As exemplified by research aiming to establish the impact of vitamin D on protecting patients from coronavirus disease 2019 (COVID-19) [3-23], the steps include focusing on establishing research questions, formulating the population, conducting a literature search for published results, selecting published studies of appropriate quality, and evaluating whether the summary measures in studies are comparable, whether the model to integrate the studies should involve fixed or random effects, and whether the heterogeneity among the study populations is acceptable in order for the findings of the meta-analysis to yield meaningful insights into the issue at hand.

Other noteworthy recent meta-analytic studies include Pearson [24] and more [25-31]. Recently, Hong et al. [14] published an article on the importance of meta-analysis in the journal of the Korean Society of Epidemiology, Epidemiology and Health. Using the inverse of the estimated variance of the studies, the fixed type of meta-analysis provides a weighted average estimate. When populations are heterogeneous, the random type is appropriate, and it is applied with inverse variance as weights or no weights at all. A disadvantage of meta-analysis is that the sources of bias are not accounted for in the calculations of heterogeneity. When the findings of studies lack significance, the results are often not reported in any publication; this phenomenon is known as publication bias (or the “file drawer” problem). The role of publication bias is beyond the scope of this paper. The reader is referred to Borenstein et al. [8] for the role of the Higgins score in relation to the heterogeneity of the sampled populations in meta-analyses and to Chernikova et al. [32] and Blumenfeld [33] for a discussion of simulation-based learning meta-analysis. The probability distribution of the Higgins statistic, I2 ≥0, is assumed to have a chi-squared distribution. However, in some studies, when Q≥df is not true, I2 does not have a chi-squared distribution. Note that Q and df refer to the Cochran Q score and degrees of freedom (df), respectively. In this manuscript, a modified approach is given to rectify this shortcoming in the Higgins statistic-based approach. The approach is illustrated by applying it to 2 examples—cognitive impairment and COVID-19 vaccination—for meta-analysis.

MATERIALS AND METHODS

An alternative meta analytic approach

Epidemiologists, biostatisticians, and investigators in other disciplines utilize the Higgins statistic, I2=Q-dfO, in meta-analysis, where Q and df are Cochran’s score and df, respectively. It is straightforward and obvious that I2 ≥0 and it is necessary that Q≥df while conducting a meta-analysis. In some studies, this requirement is not satisfied. Consequently, the Higgins statistic, I2, does not have a chi-squared distribution. We offer a modified approach to rectify this shortcoming in the Higgins statistic-based approach as follows:

The probability pattern of the Higgins statistic I2=Q-dfO is explored, and the expression Corr(Q,y)= 0 is utilized (Supplementary Material 1), where Q and df are the Cochran Q score and df, respectively. The random number, Y=y, corresponding to the number of studies on a topic available for the meta-analyst to consider at a point in time, must be y= 2,3,...,θ, in a meta-analysis, where θ is an unknown upper-bound uniform parameter. Its transformation u=y-1θ follows a probability density function (pdf) fu|θ=1-1θ-1. An additional transformation w=-2lnu has the sample space 0<w<-2ln1θ, and its pdf is fw|θ=1-1θ-112e-w2. We note that Ew|θ1-1θ and the variance is Varw|θ3Ew|θ2 (Supplementary Material 2). The survival function of w is PrW>m=1-1-1θ-11-e-m/2;m2. The incremental rate of researchers performing additional studies is hw|m=fw|θPrW>m=e-w221-1θ-1-e-w2, which stabilizes at the asymptote 1+em21-2θ-1. The conditional pdf of the statistic Q is, for a given w (Supplementary Material 2).

(1) fQ|w=e-Q2Qθe-w2-12-1/2θe-w2-12Γθe-w2-12;Q>0;0<w<2lnθ;θ1

Consequently, EQ=θ-12 and VarQ=θ+11θ-112. We have shown that Cov(df,Q)=0 and Corr(df,Q)=0 (Supplementary Material 3). We have obtained a statistical procedure to find the critical value of the new statistic,

(4) S2=I2-EI2VarI22=χ1df2=θ+116θ-1-1+dfQ31-θ+12θ-12

as the expression (4) follows a chi-squared distribution with 1 df. In other words, the p-value of a data base S2 is PrS2χ1,p-value2=p-value. These results would help the practitioner to have more confidence in conducting meta-analysis.

Ethics statement

In the article, 2 publicly available data sets were used for illustrating the usefulness of the proposed methodology. Informed consent was not required.

RESULTS

Example 1

As an illustration, we consider the recent data collected by Chen et al. [34] and Chen et al. [35] on the global prevalence of mild cognitive impairment (MCI) among elder adults living in nursing homes. The occurrence of MCI is caused by aging and/or dementia. The data they analyzed in various studies using the statistical software Stata, compiling the Q-values and the df from 53 published articles in 17 countries, are reproduced in Table 1. They concluded that there is significant heterogeneity in the studies. The Higgins statistic, I2, has been described to follow the chi-squared distribution, whose sample space should be non-negative (that is, I2 ≥0). The values of are negative (Table 1, last column) in the data for Europe and Central Asia and for the upper middle-income category. The negative values of I2 clearly attest that the Higgins statistic does not always follow the chi-squared distribution. Hence, a refined version of the Higgins statistic is a necessity, and such a revised version is our statistic, S2, whose values are displayed in Table 1.

Results of a meta-analysis on the global prevalence of mild cognitive impairment among older adults living in nursing homes

Example 2

Parents were concerned about vaccinating their children with the then-untested COVID-19 vaccine. A combined worldwide study using a meta-analysis was used to probe patterns in these concerns. A total of 98 papers across 69 different countries with 413,590 participants were examined by Alimoradi et al. [4]. The authors found that countries’ income level, location, and data collection methods were significant moderators of parents’ willingness to vaccinate their children against COVID-19. The data collection method was another significant factor influencing parental willingness. Studies collected using phone interviews had the lowest prevalence of willingness. None of the studies were thought to have exhibited heterogeneity.

Once again, the Higgins statistic, I2, exhibited negative values which violate the required non-negative sample space of the chi-squared distribution (see the last column in Table 2) in the data for all groupings. A refined version of the Higgins statistic is, once again, a necessity. For comparison, our revised statistic, I2, is displayed in Table 2.

Data on parental consent for children receiving vaccination (including Q)

DISCUSSION

A word of caution is necessary when interpreting the Higgins I2 value and its impact. There are 3 challenges in using the Higgins score, I2: (1) It is mentioned by Higgins et al. [36] that I2 is the percentage of variation across the studies that is due to heterogeneity rather than sheer chance. Khan [16] commented that “…. The I2 values of 25%, 50%, and 75% indicate low, moderate, and high heterogeneity, respectively, among the population effect sizes. I2 ≤ 25% of studies are considered to be homogeneous.” (2) Corr (Q,Y)= 0 does not imply that Q and Y are independent. (3) The I2 statistic can be negative when Q is less than df. For this situation, it is commented by Higgins et al. [36]: “Negative values of the I2 are put equal to zero so that I2 is between 0% and 100%.” This causes users to doubt the validity of the score and have less confidence in using it. These shortcomings are overcome by our refinement of the Higgins score, which we explain below:

The exact probability structure of the popularly utilized Higgins score in meta-analytic studies to assess the consistency of the findings in various studies about a healthcare topic is derived. With this probability structure, a method of finding the p-value for the Higgins score and its interpretation is devised and demonstrated. The exact new expression (4) for the score S2 is a refined version of the Higgins standardized score, which follows the chi-squared distribution with 1 df. With these new innovative results, meta-analytic researchers do not have to follow the subjective interpretations of the estimated Higgins score. Instead, the researchers could obtain the p-value for the calculated standardized S2 score based on the chi-squared distribution and conduct an objective, exact interpretation. The values of the new score S2 are objective. The authors show both the conditional and unconditional probability structures of the Higgins statistic, including how the correlation between Q and Y is derived and utilized for Q and Y to be uncorrelated and independent.

Had Higgins followed the line of the traditional thinking of statistical discipline, he could have defined the I2 score as the ratio QQ-df, and a larger value would have demonstrated heterogeneity. On the contrary, following Higgins’ definition, we ought to interpret that a smaller p-value for the chi-squared distribution implies heterogeneity. It is a tradition in the statistical discipline that a larger value of a statistic refers to significance. One can do objectively better than what is known to date regarding the implications of the Higgins score.

In conclusion, the Higgins I2 score stochastically follows a chi-squared distribution with (n-1) df, where n is the number of studies considered. In all applications, if the score is less than the df, the difference is simply considered to be 0. This zone of the probability area might not be negligible. The authors overcame this hidden shortcoming of the Higgins I2 statistic by amending it. The usefulness of the proposed methodology is illustrated by using 2 examples: (1) the global prevalence of MCI among elder adults living in nursing homes, and (2) data on vaccinating children by then-untested COVID-19 vaccines. The findings of this article have potential health policy implications.

Supplementary materials

Supplementary materials are available at https://doi.org/10.4178/epih.e2024016.

Supplementary Material 1.

A Derivation of the probability structures of the Higgins statistic I2=Q-dfQ

epih-46-e2024016-Supplementary-1.docx

Supplementary Material 2.

A Proof of Corr(Q,Y)=0.

epih-46-e2024016-Supplementary-2.docx

Supplementary Material 3.

Critical value of I2

epih-46-e2024016-Supplementary-3.docx

Notes

Conflict of interest

The authors have no conflicts of interest to declare for this study.

Funding

The project was partially supported through the National Institutes of Health grant, RCMI MD007586, awarded to the Meharry Medical College.

Author contributions

Conceptualization: Shanmugam R, Singh KP. Data curation: Shanmugam R. Formal analysis: Shanmugam R, Tabatabai M, Wilus D. Funding acquisition: Tabatabai M, Wilus D. Methodology: Shanmugam R, Singh KP, Tabatabai M. Project administration: Singh KP. Visualization: Shanmugam R, Tabatabai M, Wilus D, Singh KP. Writing – original draft: Shanmugam R, Singh KP. Writing – review & editing: Shanmugam R, Singh KP, Tabatabai M, Wilus D.

Acknowledgements

The authors are grateful to their home institutions for supporting the research done in the study.

References

1. Nicoll R, Henein MY. COVID-19 prevention: vitamin D is still a valid remedy. J Clin Med 2022;11:6818. https://doi.org/10.3390/jcm11226818.
2. Glass GV, McGaw B, Smith ML. Meta-analysis in social research 1st edth ed. Beverly Hills: Sage; 1981. p. 149.
3. AlKhafaji D, Al Argan R, Albaker W, Al Elq A, Al-Hariri M, AlSaid A, et al. The impact of vitamin D level on the severity and outcome of hospitalized patients with COVID-19 disease. Int J Gen Med 2022;15:343–352. https://doi.org/10.2147/IJGM.S346169.
4. Alimoradi Z, Lin CY, Pakpour AH. Worldwide estimation of parental acceptance of COVID-19 vaccine for their children: a systematic review and meta-analysis. Vaccines (Basel) 2023;11:533. https://doi.org/10.3390/vaccines11030533.
5. Alzahrani MA, Almalki F, Aljohani A, Alharbi B, Alsulami B, Alhaddad A, et al. The association between vitamin D serum level and COVID-19 patients’ outcomes in a tertiary center in Saudi Arabia: a retrospective cohort study. Cureus 2022;14e26266. https://doi.org/10.7759/cureus.26266.
6. Bagiu IC, Scurtu IL, Horhat DI, Mot IC, Horhat RM, Bagiu RV, et al. COVID-19 inflammatory markers and vitamin D relationship in pediatric patients. Life (Basel) 2022;13:91. https://doi.org/10.3390/life13010091.
7. Bahat G, Erbas Sacar D, Petrovic M. Vitamin D in patients with COVID-19: is there a room for it? Acta Clin Belg 2023;78:71–77. https://doi.org/10.1080/17843286.2021.2018832.
8. Borenstein M, Higgins JP, Hedges LV, Rothstein HR. Basics of meta-analysis: I2 is not an absolute measure of heterogeneity. Res Synth Methods 2017;8:5–18. https://doi.org/10.1002/jrsm.1230.
9. Dantas Damascena A, Galvão Azevedo LM, de Almeida Oliveira T, da Mota Santana J, Pereira M. Vitamin D deficiency aggravates COVID-19: discussion of the evidence. Crit Rev Food Sci Nutr 2023;63:563–567. https://doi.org/10.1080/10408398.2021.1951653.
10. Durmuş ME, Kara Ö, Kara M, Kaya TC, Şener FE, Durmuş M, et al. The relationship between vitamin D deficiency and mortality in older adults before and during COVID-19 pandemic. Heart Lung 2023;57:117–123. https://doi.org/10.1016/j.hrtlng.2022.09.007.
11. Fairfield KM, Murray KA, Anzalone AJ, Beasley W, Khodaverdi M, Hodder SL, et al. Association of vitamin D prescribing and clinical outcomes in adults hospitalized with COVID-19. Nutrients 2022;14:3073. https://doi.org/10.3390/nu14153073.
12. Fatemi A, Ardehali SH, Eslamian G, Noormohammadi M, Malek S. Association of vitamin D deficiency with COVID-19 severity and mortality in Iranian people: a prospective observational study. Acute Crit Care 2021;36:300–307. https://doi.org/10.4266/acc.2021.00605.
13. Grove A, Osokogu O, Al-Khudairy L, Mehrabian A, Zanganeh M, Brown A, et al. Association between vitamin D supplementation or serum vitamin D level and susceptibility to SARS-CoV-2 infection or COVID-19 including clinical course, morbidity and mortality outcomes? A systematic review. BMJ Open 2021;11e043737. https://doi.org/10.1136/bmjopen-2020-043737.
14. Hong JY, Kim YJ, Bae S, Kim MK. Associations of daily diet-related greenhouse gas emissions with the incidence and mortality of chronic diseases: a systematic review and meta-analysis of epidemiological studies. Epidemiol Health 2023;45e2023011. https://doi.org/10.4178/epih.e2023011.
15. Jenei T, Jenei S, Tamás LT, Putics Á, Knausz M, Hegedüs I, et al. COVID-19 mortality is associated with low vitamin D levels in patients with risk factors and/or advanced age. Clin Nutr ESPEN 2022;47:410–413. https://doi.org/10.1016/j.clnesp.2021.11.025.
16. Khan S. Meta-analysis: methods for health and experimental studies. In : Gail M, Samet JM, eds. Statistics for biology and health Singapore: Springer; 2020. https://doi.org/10.1007/978-981-15-5032-4.
17. Kolgelier S, Demir NA, Ural O, Sumer S, Kiratli HE, Kirik SY, et al. Vitamin D levels in COVID-19. Acta Medica Mediterr 2022;:691–695. https://doi.org/10.19193/0393-6384_2022_1_108.
18. Lin LY, Mulick A, Mathur R, Smeeth L, Warren-Gash C, Langan SM. The association between vitamin D status and COVID-19 in England: a cohort study using UK Biobank. PLoS One 2022;17e0269064. https://doi.org/10.1371/journal.pone.0269064.
19. Liu N, Sun J, Wang X, Zhang T, Zhao M, Li H. Low vitamin D status is associated with coronavirus disease 2019 outcomes: a systematic review and meta-analysis. Int J Infect Dis 2021;104:58–64. https://doi.org/10.1016/j.ijid.2020.12.077.
20. Lohia P, Nguyen P, Patel N, Kapur S. Exploring the link between vitamin D and clinical outcomes in COVID-19. Am J Physiol Endocrinol Metab 2021;320:E520–E526. https://doi.org/10.1152/ajpendo.00517.2020.
21. Neves FF, Pott-Junior H, de Sousa Santos S, Cominetti MR, de Melo Freire CC, da Cunha AF, et al. Vitamin D deficiency predicts 30-day hospital mortality of adults with COVID-19. Clin Nutr ESPEN 2022;50:322–325. https://doi.org/10.1016/j.clnesp.2022.05.027.
22. Bignardi PR, de Andrade Castello P, de Matos Aquino B, Delfino VD. Is the vitamin D status of patients with COVID-19 associated with reduced mortality? A systematic review and meta-analysis. Arch Endocrinol Metab 2023;67:276–288. https://doi.org/10.20945/2359-3997000000588.
23. Zidrou C, Vasiliadis AV, Tsatlidou M, Sentona M, Vogiatzis S, Beletsiotis A. The relationship between vitamin D status and the clinical severity of COVID-19 infection: a retrospective single-center analysis. Cureus 2022;14e22385. https://doi.org/10.7759/cureus.22385.
24. Pearson K. Report on certain enteric fever inoculation statistics. Br Med J 1904;2:1243–1246.
25. Pérez-Gilaberte JB, Martín-Iranzo N, Aguilera J, Almenara-Blasco M, de Gálvez MV, Gilaberte Y. Correlation between UV index, temperature and humidity with respect to incidence and severity of COVID 19 in Spain. Int J Environ Res Public Health 2023;20:1973. https://doi.org/10.3390/ijerph20031973.
26. Ramirez-Sandoval JC, Castillos-Ávalos VJ, Paz-Cortés A, Santillan-Ceron A, Hernandez-Jimenez S, Mehta R, et al. Very low vitamin D levels are a strong independent predictor of mortality in hospitalized patients with severe COVID-19. Arch Med Res 2022;53:215–222. https://doi.org/10.1016/j.arcmed.2021.09.006.
27. Kersh L, Geary K, Roberts M, Daghigh F. Does vitamin D deficiency contribute to COVID-19 severity? Curr Dev Nutr 2022;6(Suppl 1):207. https://doi.org/10.1093/cdn/nzac048.021.
28. Saygili ES, Karakiliç E. Vitamin D levels and in-hospital mortality of COVID-19. J Health Sci Med 2021;5:457–461. https://doi.org/10.32322/jhsm.1056650.
29. Purcell N, Sells J, McGrath S, Mehlman H, Bertenthal D, Seal KH. “Then COVID happened…”: veterans’ health, wellbeing, and engagement in whole health care during the COVID-19 pandemic. Glob Adv Health Med 2021;10:21649561211053828. https://doi.org/10.1177/21649561211053828.
30. Thacher TD. Evaluating the evidence in clinical studies of vitamin D in COVID-19. Nutrients 2022;14:464. https://doi.org/10.3390/nu14030464.
31. Walczak K, Walczak P, Zdun S, Nemeczek S, Merkisz K, Grzybowski J, et al. Effect of vitamin D on the course of COVID-19 infection. J Educ Health Sport 2023;13:261–267. https://doi.org/10.12775/JEHS.2023.13.02.038.
32. Chernikova O, Heitzmann N, Stadler M, Holzberger D, Seidel T, Fischer F. Simulation-based learning in higher education: a meta-analysis. Rev Educ Res 2020;90:499–541. https://doi.org/10.3102/00346543209335.
33. Blumenfeld D. Operations research calculations handbook Boca Raton: CRC Press; 2009. p. 8–9.
34. Chen P, Cai H, Bai W, Su Z, Tang YL, Ungvari GS, et al. Global prevalence of mild cognitive impairment among older adults living in nursing homes: a meta-analysis and systematic review of epidemiological surveys. Transl Psychiatry 2023;13:88. https://doi.org/10.1038/s41398-023-02361-1.
35. Chen J, Mei K, Xie L, Yuan P, Ma J, Yu P, et al. Low vitamin D levels do not aggravate COVID-19 risk or death, and vitamin D supplementation does not improve outcomes in hospitalized patients with COVID-19: a meta-analysis and GRADE assessment of cohort studies and RCTs. Nutr J 2021;20:89. https://doi.org/10.1186/s12937-021-00744-y.
36. Higgins JP, Thompson SG, Deeks JJ, Altman DG. Measuring inconsistency in meta-analyses. BMJ 2003;327:557–560. https://doi.org/10.1136/bmj.

Article information Continued

Table 1.

Results of a meta-analysis on the global prevalence of mild cognitive impairment among older adults living in nursing homes

Grouping θ=# studies df Q χ21df p-value S2 I2
Europe and Central Asia 29 28 0.35 4,682.81 <0.0011 4,682.81 -79.00
Upper middle income 8 7 0.75 91.12 <0.0011 91.12 -8.33
CAREDiag 2 1 16.51 0.81 0.3662 0.81 0.93
Age 70-74 2 1 2.84 0.44 0.5052 0.44 0.65
Before year 2000 4 3 4.85 1.23 0.2662 1.23 0.38

df, degrees of freedom; CAREDiag, Care Dementia Diagnostic Scale.

1

Refer to heterogenous.

2

Refer to homogeneous.

Table 2.

Data on parental consent for children receiving vaccination (including Q)

Grouping θ=# studies df Q χ21df p-value1 S2 I2
Lower risk of reporting bias 40 39 0.9976 1,400.78 <0.001 1,117.36 -38.09
High risk of reporting bias 58 57 0.9994 2,877.08 <0.001 2,310.81 -56.03
Developed countries 53 52 0.9993 2,412.97 <0.001 1,935.19 -51.04
Developed countries 45 44 0.9987 1,756.57 <0.001 1,404.57 -43.06
Low income 4 3 0.9961 24.73 <0.001 20.20 -2.01
Upper middle income 29 28 0.9980 753.46 <0.001 596.24 -27.06
High income 62 61 0.9975 3,290.53 <0.001 2,645.56 -60.15
Americas 27 26 0.9982 657.02 <0.001 518.86 -25.05
Southeast Asia 5 4 0.9922 33.33 <0.001 25.40 -3.03
Europe 24 23 0.9949 528.49 <0.001 415.83 -22.12
East Mediterranean 17 16 0.9970 275.30 <0.001 213.93 -15.05
West Pacific 23 22 0.9995 483.19 <0.001 379.66 -21.01
Random sampling 15 14 0.9974 218.20 <0.001 168.69 -13.04
Non-random sampling 74 73 0.9992 4,640.30 <0.001 3,739.76 -72.06
Online data collection 72 71 0.9993 4,396.27 <0.001 3,541.85 -70.05
Self-administered data 13 12 0.9952 168.59 <0.001 129.53 -11.06
Phone interview data 4 3 0.9942 24.82 <0.001 20.28 -2.02
Face to face interview data 9 8 0.9985 86.83 <0.001 65.67 -7.01

df, degrees of freedom.

1

Refer to heterogenous.

From Alimoradi Z, et al. Vaccines (Basel) 2023;11:533 [4].