
Articles
- Page Path
- HOME > Epidemiol Health > Volume 35; 2013 > Article
-
Original Article
Factors Associated with a Low-sodium Diet: The Fourth Korean National Health and Nutrition Examination Survey - Won Joon Lee, Hyeon Chang Kim, Sun Min Oh, Dong Phil Choi, Jaelim Cho, Il Suh
-
Epidemiol Health 2013;35:e2013005.
DOI: https://doi.org/10.4178/epih/e2013005
Published online: June 20, 2013
Department of Preventive Medicine, Yonsei University College of Medicine, Seoul, Korea.
- Correspondence: Hyeon Chang Kim, MD, PhD. Department of Preventive Medicine, Yonsei University College of Medicine, 50 Yonsei-ro, Seodaemun-gu, Seoul 120-752, Korea. Tel: +82-2-2228-1873, Fax: +82-2-392-8133, hckim@yuhs.ac
© 2013, Korean Society of Epidemiology
This is an open-access article distributed under the terms of the Creative Commons Attribution License (http://creativecommons.org/licenses/by/3.0/), which permits unrestricted use, distribution, and reproduction in any medium, provided the original work is properly cited.
- 17,240 Views
- 120 Download
- 16 Crossref
Abstract
-
OBJECTIVES
- The low-sodium diet is a known preventive factor for hypertension and cardiovascular disease. Factors associated with low-sodium diets should be identified to reduce sodium intake effectively. This study was conducted to identify factors correlated with a low-sodium diet.
-
METHODS
- This cross-sectional study analyzed data from a total of 14,539 Koreans aged 20 years or older, who participated in the Fourth (2007-2009) Korean National Health and Nutrition Examination Survey. A low-sodium diet was defined as having ≤2,000 mg/day based on 24-hour recalls. Multiple logistic regression models were used to assess sex, age, education, number of family members, household income, occupation, alcohol drinking, total energy intake, frequency of eating out, and hypertension management status for their associations with low-sodium diets.
-
RESULTS
- Among all participants, only 13.9% (n=2,016) had low-sodium diets. In the multivariate analysis, 40-49 years of age, clerical work jobs, higher total energy intake, and frequent eating out were inversely associated with low-sodium diets. And female sex and living-alone were associated with low-sodium diets. Lower frequency of eating out was significantly associated with low-sodium diets, even after adjusting for total energy intake and other potential confounders. Adjusted odds ratios (95% confidence interval) for a low-sodium diet were 1.97 (1.49-2.61), 1.47 (1.13-1.91), 1.24 (0.96-1.61), and 1.00 (reference) in people who eat out <1 time/month, 1-3 times/month, 1-6 times/week, and ≥1 time/day, respectively.
-
CONCLUSIONS
- Our study suggests that sex, age, number of family members, occupation, total energy intake, and lower frequency of eating out were associated with a low-sodium diet in Korean adults.
- Societies with a low-sodium diet have been observed to have a relatively low prevalence of hypertension [1], and dietary sodium reduction could reduce blood pressure in not only hypertensive but also normotensive and prehypertensive individuals [2]. Prospective studies investigating the effects of sodium intake on cardiovascular mortality have shown positive associations between dietary sodium intake and the risk of stroke [3,4] and coronary heart disease [5,6]. Also, a modest reduction in dietary salt could substantially reduce cardiovascular events and medical costs [7]. The Lancet Non-Communicable Disease (NCD) Action Group and the NCD Alliance have proposed five priority interventions, each chosen for their health effects, cost-effectiveness, low cost of implementation, and political and financial feasibility. One of these interventions is a reduced salt intake [8].
- In Korea, the average sodium intake has been estimated at 4,878 mg/day [9], more than 2.4 times the recommended amount [10]. Previous studies regarding sodium intake in Korea have addressed the sources of sodium intake by looking at sodium levels in prepared dishes [11-14]. However, few studies have evaluated individual factors related to a low-sodium diet. In order to effectively reduce sodium intake in the Korean population, we need to identify factors associated with a low-sodium diet. Accordingly, this study was conducted to identify factors correlated with a low-sodium diet in Korean adults.
INTRODUCTION
- The Fourth Korean National Health and Nutrition Examination Survey, conducted by the Korea Centers for Disease Control and Prevention over a three-year period (2007-2009), used a complex multistage sampling design to obtain a representative sample of the civilian, non-institutionalized Korean population. A total of 17,240 Koreans aged 20 years or older were enrolled during the 2007-2009 period. Of these, 2,701 participants were excluded from the present study due to absence of variables, and implausible dietary consumption, i.e., <800 kcal/day or >4,000 kcal/day in males, and <500 kcal/day or >3,500 kcal/day in females [15]. In total, 14,539 participants were eligible for this study. All participants provided written informed consent and this study was approved by an institutional review board.
- The survey consisted of three components: the Health Interview Survey, the Health Examination Survey and the Nutrition Survey. Data from the Health Interview Survey were used to obtain information on age, education, marital status, number of family members, household income quartiles, occupation, alcohol drinking, hypertension diagnosis, hypertension treatment, and comorbidities, such as stroke, myocardial infarction, ischemic heart disease, and chronic renal failure. Data on blood pressure were obtained from the Health Examination Survey. The frequency of eating out, total energy intake, and dietary sodium intake were obtained from the Nutrition Survey.
- Hypertension management status was categorized into five groups: normotension (diastolic blood pressure<80 mmHg and systolic blood pressure<120 mmHg), prehypertension (not included in the normal or hypertensive criteria), hypertension without treatment, hypertension with treatment, and hypertension with comorbidities as listed above. Dietary sodium intake (mg/day) was estimated based on a 24-hour dietary recall, and we defined a low-sodium diet as less than 2,000 mg/day [16].
- Thus, age, education, marital status, number of family members, household income, occupation, total energy intake, alcohol drinking, frequency of eating out, and hypertension management status were considered the potential factors associated with a low-sodium intake. Selection of covariates was based on the published literature review and univariate logistic regression analyses. Marital status was excluded because of its lack of statistical significance (p=0.45).
- Statistical analyses were performed using SAS version 9.2 (SAS Institute Inc., Cary, NC, USA), accounting for the multistage, stratified survey design, and survey weightings to obtain all estimated coefficients. For the descriptive analyses, gender-specific histograms of sodium intake distributions were created. Categorical variables were described by the number of participants, percentage of participants, estimated population size, and estimated percentage with survey analysis (PROC SURVEYFREQ, and PROC SURVEYMEANS). The mean sodium intake according to the variables was likewise estimated. Univariate logistic regression analysis was used to obtain odds ratios (ORs) and 95% confidence intervals (CIs) for the association between a low-sodium diet and the independent variables. Those factors identified as statistically significant by univariate analysis (p<0.05) were included as independent variables in the multivariate logistic regression model. In order to evaluate the residual confounding effect of total energy intake, the association between the frequency of eating out and a low-sodium diet was further analyzed separately according to the tertiles of total energy intake.
MATERIALS AND METHODS
- The characteristics of the study population are shown in Table 1. The mean age of the study population was 45.7 years. Those who were unemployed represented the highest frequency in the occupation variable, explained by the fact that the unemployed group included students and housewives. In total, 13.9% of the study participants consumed less than 2,000 mg/day sodium. This value compares with 11.9% (estimated number of people=3,559,822) in the Korean population.
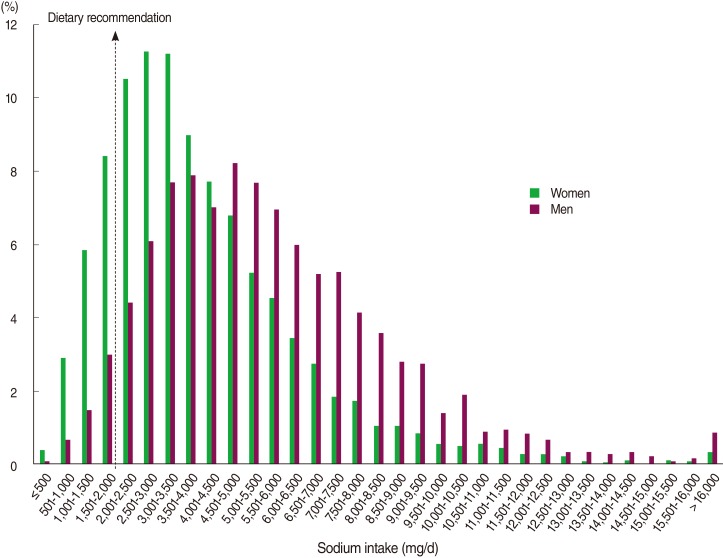
- Figure 1 gives the distribution of sodium intake in Korean women and men. The median (25th-75th percentile) values of sodium intake were 4,208 (2,812-6,159) mg/day in women and 5,205 (3,632-7,247) mg/day in men. The distribution of sodium intake was much higher in men than in women (p<0.05). Accordingly, only 5.2% of male adults (estimated number=706,909) consumed less than 2,000 mg/day sodium, while the corresponding percentage in female adults was 17.5% (estimated number=2,852,912).
- Table 2 shows the mean sodium intake and its 95% CI according to the variables examined. In each category, there were significant differences in mean sodium intake according to the statistical test used, such as a t-test or analysis of variance (ANOVA). Mean sodium intake was highest in people aged 40-49 years. Higher levels of education, household income, total energy intake, higher number of family members, alcohol drinking, and more frequent eating out were associated with higher mean sodium intake. According to hypertension management status, those with prehypertension had the highest sodium intake, while those with hypertension with comorbidity consumed the least sodium.
- The factors associated with a low-sodium diet are shown in Table 3. All covariates were significantly associated with a low-sodium diet in the univariate logistic regression. However, the associations found with education, household income, alcohol drinking, and hypertension management status disappeared in the multivariate analysis. The following factors were associated with a reduced OR for a low-sodium diet: aged 40-49 years (OR=0.63 compared to 20-39 years), and employed in clerical work (OR=0.56 compared to unemployment). A low-sodium intake was associated with female sex (OR=1.55) and living alone (OR=1.31 compared to living in a large family, i.e., ≥4 people). Total energy intake was the strongest determinant of a low-sodium diet. Therefore, the ORs for a low-sodium diet increased with decreasing total energy intake: >75% (reference), 50-74% (OR=2.58), 25-49% (OR=7.19), and <25% (OR=25.82). People who ate out less than once per month (OR=2.01) and one to three times per month (OR=1.51) had significantly higher odds of having a low-sodium diet when compared with those who ate out more than once per day.
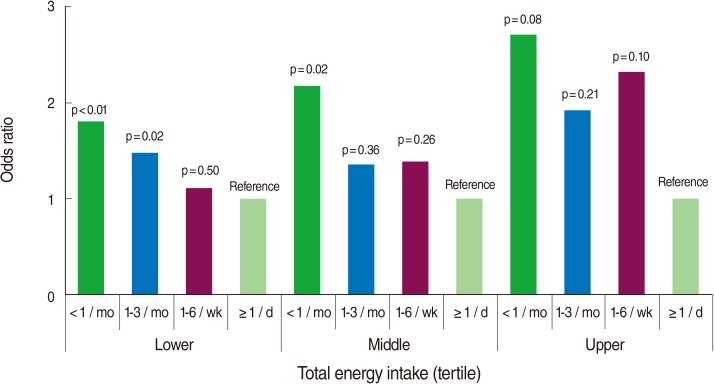
- Figure 2 illustrates the association between the frequency of eating out and a low-sodium diet separately in the tertiles of total energy intake. Each model was adjusted for sex, age, education, number of family members, household income, occupation, total energy intake (as a continuous measure), alcohol drinking, and hypertension management status. The OR for a low-sodium diet tended to decrease with increased frequency of eating out, divided by tertile of total energy intake in all three groups, although the statistical significance varied between groups.
RESULTS
- Our results indicate that next to total energy intake, frequency of eating out was one of the most important determinants of a low-sodium diet, followed by sex, age, number of family members, and occupation. On the other hand, factors such as education, household income, alcohol drinking, and hypertension management status were not significantly associated with the consumption of a low-sodium diet.
- This association between the frequency of eating out and a low-sodium diet was found in Korean adults. This observation is in agreement with a previous study of occupational settings [17]. It implies that interventions aimed at reducing the frequency of eating out may be effective in reducing sodium intake. Individual efforts to reduce the frequency of eating out may help to reduce sodium intake. In the meantime, policies concerning the food service industry could effectively reduce sodium intake at the population level.
- Individuals in a higher income bracket have been shown to have a significantly higher mean intake for most of the nutrients examined, including total energy and sodium [18]. The current study similarly showed that having a higher household income was associated with a lower probability for a low-sodium diet. However, after adjusting for total energy intake, the relationship between income and a low-sodium diet disappeared.
- A low-sodium diet was more frequent in those who lived alone compared with those who lived in a large family (≥4 people). A larger family is more likely to include a senior (elderly) family member. It is known that the elderly prefer a salty taste because the senses of taste decrease with normal aging and disease [19]. Consequently, people living in a large family might tend to consume more sodium.
- We expected that people who were under treatment for hypertension and those who had hypertension-related cormobidities would consume less sodium than those who were normotensive. However, unexpectedly, there was no association between hypertension management status and a low-sodium diet in the multivariate analysis. The majority of people consumed more than the recommended amount of sodium, regardless of their blood pressure levels and hypertension-related health problems. One of the possible reasons for this negative result could be that individual efforts to reduce sodium intake has little effect on sodium intake, because almost all Korean food is high in sodium content. Another reason could be that hypertensive patients, with or without comorbidity, are mainly controlled by the use of hypertensive medication, and both patients and physicians make little effort to change their eating habits [20].
- The present study also has several limitations. Firstly, because of its cross-sectional design, this study could not establish a temporal relationship between the factors studied and a low-sodium diet. Secondly, there might be measurement error in the sodium intake which was based on a 24-hour dietary recall. A previous study showed that 24-hour dietary recalls yielded estimates of sodium intake that were about 22% less than those obtained from 24-hour urine collection [21]. Therefore, the mean sodium intake would be underestimated using a 24-hour recall estimate, and the number of people with a low-sodium diet would be overestimated when compared to actual sodium intake. If the measurement error was non-differential, the observed associations between the factors analyzed and a low-sodium diet would likely be weaker than the real associations. It is known that a single 24-hour recall does not represent usual intake because of large day-to-day variations [15]. However, this method has been most widely used in national nutritional surveys such as the National Health and Nutrition Examination Survey, United Sates Department of Agriculture Nationwide Food Consumption Surveys, and the Continuing Surveys of Food Intakes by Individuals.
- In conclusion, sex, age, number of family members, occupation, total energy intake, and frequency of eating out were shown to be correlated with a low-sodium diet in Korean adults. Strategies concerning the frequency of eating out or policies regulating the food service industry would be effective in reducing overall sodium intake in Koreans.
DISCUSSION
-
The authors have no conflicts of interest to declare for this study.
-
This article is available from: http://e-epih.org/.
NOTES
- 1. Elliott P, Stamler J, Nichols R, Dyer AR, Stamler R, Kesteloot H, et al. Intersalt Cooperative Research Group. Intersalt revisited: further analyses of 24 hour sodium excretion and blood pressure within and across populations. BMJ 1996;312:1249-1253. 8634612.ArticlePubMedPMC
- 2. Appel LJ, Espeland MA, Easter L, Wilson AC, Folmar S, Lacy CR. Effects of reduced sodium intake on hypertension control in older individuals: results from the Trial of Nonpharmacologic Interventions in the Elderly (TONE). Arch Intern Med 2001;161:685-693. 11231700.ArticlePubMed
- 3. He J, Ogden LG, Bazzano LA, Vupputuri S, Loria C, Whelton PK. Dietary sodium intake and incidence of congestive heart failure in overweight US men and women: first National Health and Nutrition Examination Survey Epidemiologic Follow-up Study. Arch Intern Med 2002;162:1619-1624. 12123406.ArticlePubMed
- 4. Nagata C, Takatsuka N, Shimizu N, Shimizu H. Sodium intake and risk of death from stroke in Japanese men and women. Stroke 2004;35:1543-1547. 15143292.ArticlePubMed
- 5. Tuomilehto J, Jousilahti P, Rastenyte D, Moltchanov V, Tanskanen A, Pietinen P, et al. Urinary sodium excretion and cardiovascular mortality in Finland: a prospective study. Lancet 2001;357:848-851. 11265954.ArticlePubMed
- 6. Cook NR, Cutler JA, Obarzanek E, Buring JE, Rexrode KM, Kumanyika SK, et al. Long term effects of dietary sodium reduction on cardiovascular disease outcomes: observational follow-up of the trials of hypertension prevention (TOHP). BMJ 2007;334:885-888. 17449506.ArticlePubMedPMC
- 7. Bibbins-Domingo K, Chertow GM, Coxson PG, Moran A, Lightwood JM, Pletcher MJ, et al. Projected effect of dietary salt reductions on future cardiovascular disease. N Engl J Med 2010;362:590-599. 20089957.ArticlePubMedPMC
- 8. Beaglehole R, Bonita R, Horton R, Adams C, Alleyne G, Asaria P, et al. Priority actions for the non-communicable disease crisis. Lancet 2011;377:1438-1447. 21474174.ArticlePubMed
- 9. Korea Centers for Disease Control and Prevention. Korea health statistics 2009: Korea National Health and Nutrition Examination Survey (KNHANES IV-3). Seoul: Ministry of Heath and Welfare; 2010. p 321 (Korean).
- 10. World Health Organization. Diet, nutrition, and the prevention of chronic diseases: report of a joint WHO/FAO expert consultation. Geneva: World Health Organization; 2003. p 56.
- 11. Son SM, Park YS, Lim HJ, Kim SB, Jeong YS. Sodium intakes of Korean adults with 24-hour urine analysis and dish frequency questionnaire and comparison of sodium intakes according to the regional area and dish group. Korean J Community Nutr 2007;12:545-558 (Korean).
- 12. Moon HK, Choi SO, Kim JE. Dishes contributing to sodium intake of elderly living in rural areas. Korean J Community Nutr 2009;14:123-136 (Korean).
- 13. Yon M, Lee MS, Oh SI, Park SC, Kwak CS. Assessment of food consumption, dietary diversity and dietary pattern during the summer in middle aged adults and older adults living in Gugoksoondam logevity area, Korea. Korean J Community Nutr 2010;15:536-549 (Korean).
- 14. Yon M, Lee Y, Kim D, Lee J, Koh E, Nam E, et al. Major sources of sodium intake of the Korean population at prepared dish level: based on the KNHANES 2008 & 2009. Korean J Community Nutr 2011;16:473-487 (Korean).Article
- 15. Willett W. Nutritional epidemiology. 2nd ed. New York: Oxford University Press; 1998. p 322.
- 16. Korean Nutrition Society. Dietary reference intakes for Koreans. Seoul: Korean Nutrition Society; 2010. p 376 (Korean).
- 17. Kim HH, Shin EK, Lee HJ, Lee NH, Chun BY, Ahn MY, et al. Evaluation of the effectiveness of a salt reduction program for employees. Korean J Nutr 2009;42:350-357 (Korean).Article
- 18. Kim BH, Lee JW, Lee Y, Lee HS, Jang YA, Kim CI. Food and nutrient consumption patterns of the Korean adult population by income level - 2001 National Health and Nutrition Survey. Korean J Community Nutr 2005;10:952-962 (Korean).
- 19. Schiffman SS. Taste and smell losses in normal aging and disease. JAMA 1997;278:1357-1362. 9343468.ArticlePubMed
- 20. Chun BY, Shin JY. The scientific evidence for the management of prehypertensives and high risk group. J Korean Med Assoc 2011;54:1013-1019 (Korean).Article
- 21. Espeland MA, Kumanyika S, Wilson AC, Reboussin DM, Easter L, Self M, et al. Statistical issues in analyzing 24-hour dietary recall and 24-hour urine collection data for sodium and potassium intakes. Am J Epidemiol 2001;153:996-1006. 11384956.ArticlePubMed
REFERENCES


OR, odds ratio; CI, confidence interval
Statistically significant estimates (p<0.05) appear in bold.
*Adjusted for sex, age, education, number of family members, household income, occupation, total energy intake, alcohol drinking, frequency of eating out, and hypertension management status; †Comorbidity includes stroke, myocardial infarction, ischemic heart disease and chronic renal failure.
Figure & Data
References
Citations
- Comparison between 24-hour diet recall and 24-hour urine collection for estimating sodium and potassium intakes and their ratio among Korean adults
Taisun Hyun, Mi-Kyeong Choi, Young-Ran Heo, Heekyong Ro, Young-Hee Han, Yeon-Kyung Lee
Nutrition Research and Practice.2023; 17(2): 284. CrossRef - Association between Eating Habits and Sodium Intake among Chinese University Students
Minchan Wu, Yue Xi, Jiaqi Huo, Caihong Xiang, Cuiting Yong, Jiajing Liang, Hanshuang Zou, Yunfeng Pan, Qingqing Xie, Qian Lin
Nutrients.2023; 15(7): 1570. CrossRef - Sodium and Potassium Urinary Excretion Among Malaysian Adults Claiming to Practice Salt-control: Findings from the Malaysian Community Salt Survey (MyCoSS)
Munawara Pardi, Syafinaz Mohd Sallehuddin, Lalitha Palaniveloo, Norazizah Wong Ibrahim
Malaysian Journal of Medicine and Health Sciences.2022; 18(6): 5. CrossRef - Estimation of salt intake assessed by 24-h urinary sodium level among adults speaking different dialects from the Chaoshan region of southern China
Fen Cai, Wen-Ya Dong, Jia-Xin Jiang, Xiao-Li Chen, Yue Wang, Chang-Yu Deng, Qing-Ying Zhang
Public Health Nutrition.2021; 24(2): 290. CrossRef - Mood and Metabolic Health Status of Elderly Osteoporotic Patients in Korea: A Cross-Sectional Study of a Nationally Representative Sample
Hyen Chul Jo, Gu-Hee Jung, Seong-Ho Ok, Ji Eun Park, Jong Chul Baek
Healthcare.2021; 9(1): 77. CrossRef - Prevalence of prehypertension and its risk factors in midlife and late life: Indonesian family life survey 2014–2015
Aida Lydia, Siti Setiati, Czeresna Heriawan Soejono, Rahmi Istanti, Jessica Marsigit, Muhammad Khifzhon Azwar
BMC Public Health.2021;[Epub] CrossRef - Regional disparities in healthy eating and nutritional status in South Korea: Korea National Health and Nutrition Examination Survey 2017
Jounghee Lee, Jaesin Sa
Nutrition Research and Practice.2020; 14(6): 679. CrossRef - Inverse association of improved adherence to dietary guidelines with metabolic syndrome: the Seoul Metabolic Syndrome Management program
Dongwoo Ham, YoungYun Cho, Mi-Suk Park, Yun-Sug Park, Sun-Young Kim, Hye-Min Seol, Yoo Mi Park, Sunok Woo, Hyojee Joung, Do-Sun Lim
Nutrition Research and Practice.2020; 14(6): 621. CrossRef - Association between family dinner and BMI in adults: data from the 2013 to 2015 Korean National Health and Nutrition Examination Survey
Woongchan Rah, Jaewon So, Eun-Cheol Park, Sang Ah Lee, Sung-In Jang
Public Health Nutrition.2019; 22(4): 681. CrossRef - Global Impact of the 2017 American College of Cardiology/American Heart Association Hypertension Guidelines
Hyeon Chang Kim, Yong Woo Jeon, Sung Taik Heo
Circulation.2018; 138(21): 2312. CrossRef - Sodium excretion and health-related quality of life: the results from the Korea National Health and Nutrition Examination Survey 2010–2011
Hye Min Choi, Kyu-Beck Lee, Hyang Kim, Young Youl Hyun
European Journal of Clinical Nutrition.2018; 72(11): 1490. CrossRef - Trends in Blood Pressure and Prevalence of Hypertension in Korean Adults Based on the 1998–2014 KNHANES
Tae-Jong Kim, Jae-woo Lee, Hee-Taik Kang, Myeong-Chan Cho, Hyoung-Ji Lim, Jin-Young Kim, Jang-Whan Bae, Yong-Jae Lee, Sang-Hyun Lee, John A. Linton, Yeseul Kim
Yonsei Medical Journal.2018; 59(3): 356. CrossRef - Socioeconomic Determinants of Sodium Intake in Adult Populations of High-Income Countries: A Systematic Review and Meta-Analysis
Carlos de Mestral, Ana-Lucia Mayén, Dusan Petrovic, Pedro Marques-Vidal, Murielle Bochud, Silvia Stringhini
American Journal of Public Health.2017; 107(4): e1. CrossRef - Factors Associated With High Sodium Intake Based on Estimated 24-Hour Urinary Sodium Excretion
Jae Won Hong, Jung Hyun Noh, Dong-Jun Kim
Medicine.2016; 95(9): e2864. CrossRef - Evaluation of dietary intake in Korean adults according to energy intake from eating-out: Based on 2013~2014 Korea National Health and Nutrition Examination Survey
Yun-Jung Bae
Journal of Nutrition and Health.2016; 49(6): 482. CrossRef - The Korea National Health and Nutrition Examination Survey (KNHANES): current status and challenges
Yuna Kim
Epidemiology and Health.2014; 36: e2014002. CrossRef
 PubReader
 ePub Link
 Cite
Cite- Figure
-
- Related articles
-
- Associations of the magnesium depletion score and magnesium intake with diabetes among US adults: an analysis of the National Health and Nutrition Examination Survey 2011-2018
- Folate, vitamin B12, and homocysteine status in the Korean population: data from the 2013-2015 Korea National Health and Nutrition Examination Survey
- Higher energy consumption in the evening is associated with increased odds of obesity and metabolic syndrome: findings from the 2016-2018 Korea National Health and Nutrition Examination Survey (7th KNHANES)
- Effects of multigrain rice and white rice on periodontitis: an analysis using data from the Korea National Health and Nutrition Examination Survey 2012-2015
- Regional differences in the associations of diet quality, obesity, and possible sarcopenia using the seventh Korea National Health and Nutrition Examination Survey (2016-2018)

