
Articles
- Page Path
- HOME > Epidemiol Health > Volume 45; 2023 > Article
-
Original Article
Regional differences in the associations of diet quality, obesity, and possible sarcopenia using the seventh Korea National Health and Nutrition Examination Survey (2016-2018) -
Hyeongyeong Lee1,2
 , Sohyun Park1,2
 -
Epidemiol Health 2023;45:e2023059.
DOI: https://doi.org/10.4178/epih.e2023059
Published online: June 19, 2023
1Department of Food Science and Nutrition, Hallym University, Chuncheon, Korea
2The Korean Institute of Nutrition, Hallym University, Chuncheon, Korea
- Correspondence: Sohyun Park Department of Food Science and Nutrition, Hallym University, 1 Hallymdaehak-gil, Chuncheon 24252, Korea E-mail: sopark@hallym.ac.kr
© 2023, Korean Society of Epidemiology
This is an open-access article distributed under the terms of the Creative Commons Attribution License (http://creativecommons.org/licenses/by/4.0/), which permits unrestricted use, distribution, and reproduction in any medium, provided the original work is properly cited.
Abstract
-
OBJECTIVES
- Sarcopenic obesity is closely related to aging and the prevalence of various chronic diseases and frailty. The purpose of this study was to analyze whether diet quality is related to obesity, sarcopenia, and sarcopenic obesity, and if so, to explore the difference in that relationship between urban and rural settings.
-
METHODS
- Using data from the Korea National Health and Nutrition Examination Survey of 2016-2018, a total of 7,151 participants aged 40 years or older were analyzed. Sarcopenia was diagnosed using handgrip strength. Diet quality was assessed using Korea Healthy Eating Index (KHEI) scores, and obesity was determined based on participants’ abdominal circumference. Multinomial logistic analysis was used for testing statistical significance.
-
RESULTS
- Rural participants had significantly lower KHEI scores and a higher prevalence of sarcopenic obesity than urban participants. The study findings demonstrate that participants without obesity, sarcopenia, or sarcopenic obesity had significantly higher KHEI scores in both rural and urban settings. Multinomial regression analysis further revealed that a higher KHEI score was associated with a lower risk of sarcopenia and sarcopenic obesity among urban residents, while only the risk of obesity was lower with higher diet quality scores among rural residents.
-
CONCLUSIONS
- Since diet quality and health status were lower in rural areas, it is important to address this regional disparity with appropriate policy measures. To mitigate urban health disparities, urban residents in poor health with few resources should also be supported.
- Body composition changes with age, including loss of muscle and an increase in body fat [1,2]. Muscle loss can lead to major health issues, such as a higher risk of falls in the elderly [3]. A study using US National Health and Nutrition Examination Survey data showed that among the elderly, the prevalence of functional disorders was higher in participants with a low muscle index (muscle mass divided by body weight, as a percentage) [4].
- Sarcopenia is a musculoskeletal disease that has received increasing medical attention and was classified as a disease in 2016 by the International Classification of Diseases, 10th revision, Clinical Modification [5]. Sarcopenia is significantly associated with physical dysfunction [6], falls [7], and the prevalence of metabolic disorders [8]. Sarcopenia has also been shown to predict mortality [9].
- Sarcopenia is generally diagnosed using 3 criteria that reflect skeletal muscle function: muscle strength, muscle mass, and physical performance. Muscle strength is considered the most important characteristic of sarcopenia by the European Working Group on Sarcopenia in Older People (EWGSOP) [10]. Low muscle strength has been termed probable sarcopenia by the EWGSOP [10] and possible sarcopenia (PS) by the Asian Working Group for Sarcopenia (AWGS) [11]. It is underscored that effective intervention at early stages can prevent, delay, and treat sarcopenia [10,12]; early diagnosis can also reduce medical costs. According to United States data from a study published in 2004, the direct medical costs of sarcopenia exceeded 18 billion dollars per year [13].
- In numerous cases, muscle mass decreases and body fat increases with aging. In a study that monitored the effects of aging on body composition for 10 years, body fat increased in both males and females as age increased [14]. Changes in body composition, such as increased body mass index (BMI), body fat, and abdominal visceral fat, are associated with not only a risk of functional and physical disorders but also cardiovascular disease and type 2 diabetes [15,16]. Sarcopenic obesity includes both sarcopenia, in which muscle mass and muscle strength decrease, and increased body fat. Studies have shown associations between sarcopenic obesity and lower physical function [17], mild cognitive impairment, and dementia [18]. Hence, sarcopenic obesity is a crucial health issue due to its close association with negative health outcomes in the elderly.
- Diet plays a critical role in the risk and prevention of sarcopenia. Vitamin D and protein have protective effects against the muscular loss and functional impairment associated with aging, including sarcopenia [19,20]. Although it has been reported that the probability of frailty is lowest with a higher Mediterranean diet score [21,22], an association has not yet been established between sarcopenia and dietary patterns or quality. A previous study emphasized the importance of sufficient protein intake in every meal [23], and diverse dietary patterns improved handgrip strength (HGS) and gait speed [24]. It may be important to improve the overall quality of meals, rather than increase consumption of certain nutrients.
- Previous studies have reported regional variations in diet quality. Specifically, the diets of elderly patients residing in rural areas are comparatively worse than those in urban areas, even after adjustment for socio-demographic variables [25]. Furthermore, regional differences are seen for various health indices, and in numerous cases, disease prevalence and health behavior are worse in rural areas [26-28]. Despite such variance in diet quality or health indices, regional studies examining associations between diet quality and sarcopenic obesity are still lacking. Therefore, our study aimed to examine the association of obesity and PS with diet quality in adults aged 40 years or older. The effect of regional differences on this association was also examined.
INTRODUCTION
- Data and participants
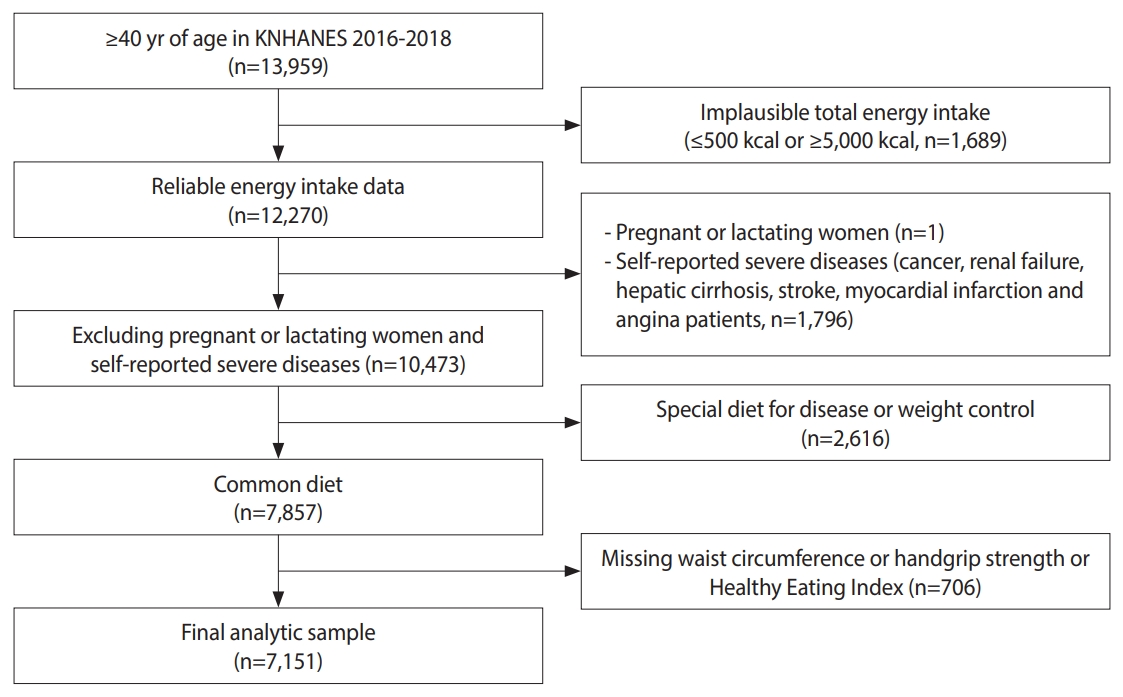
- The Korea National Health and Nutrition Examination Survey (KNHANES) is a program resulting in nationally representative data about health and food consumption behavior in Korea [29]. This study analyzed data from the KNHANES. Given that obesity and sarcopenia tend to develop after age 40, our study focused on participants aged 40 and older [30]. Individuals were excluded from the analysis if their energy intake was ≤ 500 kcal or ≥ 5,000 kcal (n=1,689), if they were pregnant or lactating (n=1), or if they had diseases that may affect diet, such as cancer (n=883), renal failure (n=53), hepatic cirrhosis (n=47), stroke (n=386), and myocardial infarction and angina (n=427). Additionally, individuals on a special diet for disease or weight control (n=2,616) were excluded, as were those whose records lacked waist circumference (n=398), HGS (n=307), or Korean Healthy Eating Index (KHEI) information (n=1). Data from 7,151 participants were used for analysis (Figure 1).
- Measurement of muscle strength and assessment of sarcopenia
- Among various methods of assessing muscle strength, large-scale studies have commonly used HGS measurements [31]. The EWGSOP guidelines recommend diagnosing PS using HGS [10]; The KNHANES also measured HGS to assess the muscle strength of participants. The HGS indices included in data from the seventh KNHANES were measured with a digital grip strength dynamometer (TKK 5401 Grip-D; Takei, Japan) in participants aged 10 years or older. HGS was measured 6 times (3 times per hand), and the maximum value among the 6 measurements was used in this study. According to the AWGS 2019 criteria, men whose maximum HGS was 28 kg or lower and women whose maximum HGS was 18 kg or lower were classified as having PS.
- Assessment of diet quality
- Diet quality was assessed using KHEI scores. The KHEI consists of 14 items based on domestic guidelines for healthy eating habits: 8 items evaluating the adequacy of recommended food and nutrient intake (KHEI adequacy score), 3 items evaluating the intake of restricted food and nutrients (KHEI moderation score), and 3 items evaluating the balance of energy intake (KHEI energy balance score). The total score is calculated by adding the scores from each item, and a higher KHEI indicates an overall higher diet quality [32,33]. This allows the evaluation of overall eating habits and diet quality in Korean adults.
- Assessment of obesity
- Obesity is commonly diagnosed by BMI or abdominal circumference. Since middle-aged and elderly adults were the subjects of our analysis, obesity was determined based on abdominal circumference, which better reflects body fat distribution in both groups and predicts morbidity and mortality more effectively [34,35]. Abdominal circumference ≥ 85 cm and ≥ 90 cm was used to define obesity for women and men, respectively [36].
- Statistical analysis
- The variables used in the analysis are area (urban or rural); household type; household income; education level; health behaviors such as smoking, alcohol consumption, and physical activity; food security; and the number of chronic diseases. For area, households in dong (neighborhood) administrative divisions were classified as urban, and households in eup (town) and myeon (township) divisions were classified as rural.
- Household type was classified as “single member” or “non-single.” Household income was classified into quartiles (lowest, lower middle, upper middle, and highest). Education level was classified into 4 groups (elementary school or less, middle school, high school, and college and above). Smoking status was classified as “current smoker,” “past smoker,” and “never.” Alcohol consumption was classified as “no” for those who reported drinking less than 1 glass per month over the past year or never having consumed alcohol. Physical activity was categorized as “yes” for those who performed moderate physical activities weekly for at least 2 hours and 30 minutes, high-intensity physical activities weekly for at least 1 hour and 15 minutes, or a mixture of moderate and high-intensity physical activities (1 minute at high intensity equals 2 minutes at moderate intensity) for the corresponding durations per week. Food security was classified as “sufficient,” “quality insufficient” when participants responded that they did not have diverse food items, and “quality and quantity insufficient” when participants responded that they lacked sufficient foods due to financial hardship. Chronic disease was classified into 0-1, 2, and 3 by the number of diseases with which the participants were diagnosed, among diabetes, hypertension, and dyslipidemia.
- When analyzing the data, sampling weights were used to reflect the complex sample design specified in the data usage guide of the seventh KNHANES [37]. Categorical variables were described in frequency and percentage, and the chi-square test was applied. Linear regression analysis was used to compare the KHEI mean scores according to type of residential area and the presence of obesity and sarcopenia. The means and standard errors (SEs) of KHEI scores were presented after adjusting for age and gender. For the analysis of odds ratios (OR) of sarcopenia and obesity according to KHEI scores, multinomial logistic regression was used with adjustment for age, gender, household type, household income, education level, health behaviors (smoking, drinking, physical activities), food security status, and the presence of chronic disease, which were all found to be associated with obesity and sarcopenia status and type of residential area. All analyses were conducted using Stata/MP 17.0 (StataCorp., College Station, TX, USA) with 2-tailed 95% confidence intervals (CIs) and a statistical significance threshold of p< 0.05.
- Ethics statement
- The study protocol was approved by the Institutional Review Board of Hallym University (HIRB-2021-087) and Korea Centers for Disease Control and Prevention (KCDC) (waived from 2015 to 2017, and 2018-01-03-P-A).
MATERIALS AND METHODS
- The general characteristics of the participants by type of residential area are shown in Table 1. Among the 7,151 participants, 22.7% resided in rural areas. The percentage of residents aged 65 years or older was higher in rural (44.7%) than in urban areas (30.2%). The proportion of single-person households was higher in rural areas, and education level was higher among urban residents. There was no difference in the percentage of current smokers between urban and rural areas, but alcohol consumption and participation in physical activity were higher in urban than rural residents. There was no difference in food security status. In rural areas, more participants had 2 or more chronic diseases compared to urban residents. Obesity, sarcopenia, and sarcopenic obesity were more prevalent in rural than in urban areas. For KHEI scores reflecting diet quality, the total scores (65.37 vs. 63.39), adequacy score (32.39 vs. 30.91), and energy balance score (8.97 vs. 7.88) were significantly lower in rural than in urban residents.
- The general characteristics of the participants according to obesity and sarcopenia are shown in Table 2. In the sarcopenia and sarcopenic obesity groups, the percentages of participants aged 65 years or older were higher than for participants aged 40-64 years old. The proportions of sarcopenia and sarcopenic obesity were higher in the groups with lower household income, and they were highest in the group with the lowest education level. A comparison of health behaviors showed that the smoking rate was the highest in participants with obesity, and the drinking rate was lower in participants with sarcopenia and sarcopenic obesity compared to participants with obesity. Physical activity also gradually decreased from the normal group to the sarcopenic obese group. For food security, the response rate of “quality and quantity insufficient” was highest in the sarcopenic obesity group. Having 2 or more chronic diseases was most likely in the group with sarcopenic obesity.
- A comparison of KHEI scores according to the presence of sarcopenia and obesity in both types of areas is shown in Table 3. In urban residents, the mean KHEI total score was 66.33±0.28 in the normal group, 65.22±0.37 in the obesity group, 61.22±0.81 in the sarcopenia group, and 60.18±0.92 in the sarcopenic obesity group. In rural residents, the KHEI total score was 64.26±0.60 in the normal group, 62.56±0.75 in the obesity group, 60.69±1.12 in the sarcopenia group, and 59.34±1.65 in the sarcopenic obesity group. The KHEI total score was lowest in the sarcopenic obesity groups in both urban and rural areas. In both urban and rural areas, the highest KHEI adequacy scores were found in normalweight participants, followed in descending order by participants with obesity, sarcopenia, and sarcopenic obesity. The highest KHEI energy balance score was found in the normal group, followed in descending order by the obesity, sarcopenia, and sarcopenic obesity groups, but with statistical significance in urban areas only.
- The results from the multinomial logistic regression models are presented in Table 4. ORs are shown for obesity, sarcopenia, and sarcopenic obesity compared to the normal group, with respect to KHEI scores in both urban and rural areas. Among urban residents, an increase of 1 unit in KHEI scores was associated with a significant decrease in the odds for sarcopenia (OR, 0.98; 95% CI, 0.97 to 0.99) and sarcopenic obesity (OR, 0.97; 95% CI, 0.95 to 0.98), while the OR for obesity did not show statistical significance. Conversely, among rural residents, an increase of 1 unit in KHEI scores was associated with a significant decrease in the odds for obesity (OR, 0.98; 95% CI, 0.97 to 0.99), but not for sarcopenia or sarcopenic obesity. The interaction terms between diet quality and obesity/sarcopenia status were not statistically significant, indicating that the association between diet quality and obesity/sarcopenia did not differ by type of residential area.
RESULTS
- Diet plays a crucial role in the risk and prevention of sarcopenia; however, studies analyzing the correlation between dietary patterns and diet quality are lacking [38]. Moreover, previous studies have shown that there is a significant disparity in diet quality and the risk of disease in different areas, even within a country [26]. Therefore, this study aimed to examine whether the association of KHEI scores with sarcopenia and obesity differed depending on participants’ residential area using KNHANES data. In both urban and rural areas, diet quality was the highest in the normal group and the lowest in the sarcopenic obese group (Table 3). This is consistent with previous studies reporting that the prevalence of sarcopenia was lower in men elderly patients who had higher index-international scores of diet quality [24].
- Our results showed that rural residents showed a higher prevalence of obesity, sarcopenia, and sarcopenic obesity than urban residents. Since this reflects the crude prevalence without age adjustment, this finding could have been due to a higher proportion of elderly people in rural areas. Key health behaviors and health indicators also showed some negative values among rural participants, along with other variables of socioeconomic status. This aligns with previous studies showing disparities in frailty and aging-related health indicators between urban and rural areas [28]. Discussions of health disparities between urban and rural areas are ongoing outside of Korea as well [27].
- Diet quality, measured with the KHEI, was also significantly lower in rural participants. In detail, the largest difference was in KHEI adequacy scores, and urban areas also scored higher than rural areas for KHEI energy balance. Other studies have shown that individual gender, age, education level, behaviors such as smoking, and obesity rate were associated with KHEI scores [39]. However, this relationship may also result from differences in the local food environment, as well as various socio-demographic and economic variables. In particular, the food environments experienced by the elderly in urban and rural areas are bound to be different. Even with the adjustment of variables that affect individual eating habits, diet quality is poorer in the elderly residents of rural areas than in elderly urban residents. Our study is in line with previous studies analyzing factors affecting diet quality in Korea’s urban and rural areas [25].
- It is widely acknowledged that the food environment, especially the accessibility of food, is sparser in rural than in urban areas, as shown by both domestic and international studies [39,40]. Access to grocery stores can be difficult in rural areas with a low population density, and ingredients are less fresh, reducing customers’ satisfaction [41]. Considering the lack of public transportation and lower income status in many rural areas, it can be quite challenging to access food there [42]. This implies that community-level interventions are necessary to improve the rural food environment and thus the diet quality among rural residents. These factors may affect future health indicators such as obesity and sarcopenia.
- Our study showed that those with both obesity and sarcopenia had the worst health behaviors and the lowest socio-demographic status compared to participants with either obesity or sarcopenia alone. Similarly, a previous study reported that the presence of sarcopenic obesity had more negative effects on elderly individuals than the presence of only obesity or sarcopenia [17]. It has been reported that larger quantities of body fat exerted direct and indirect effects on the balance of muscle amino acids by inducing the expression of tumor necrosis factor, which can alter protein metabolism via alterations to insulin sensitivity [43]. Another study has shown that muscle loss induces insulin resistance by reducing the mass of insulin response target tissues, which promotes metabolic syndrome and obesity [44]. An increase in fat and a loss of muscle may act together to trigger disorders and morbidity synergistically [45]. It was reported that compared to sarcopenia, sarcopenic obesity is associated with lower physical function [17], and the risk of cardiovascular disease increased in the sarcopenic obesity group by 23% compared to the normal group, whereas the risk did not significantly increase in the sarcopenia or obese groups [46]. In addition, a study has shown that obesity in older individuals was associated with a decline in muscle mass and quality of life [47]. These results suggest that sarcopenic obesity, as a combination of sarcopenia and obesity, may pose an even greater risk for aging individuals.
- In both rural and urban areas, the KHEI scores for overall diet quality were highest in the normal group, followed in descending order by the normal, obesity, sarcopenia, and sarcopenic obesity groups. To understand whether this pattern of a linear decrease in diet quality is the same in urban and rural areas, the significance of the interaction term was analyzed. The result was statistically significant (Table 3), which suggests that health indicators such as sarcopenic obesity have a higher correlation with KHEI scores for urban residents. Although few studies have examined health disparities within urban areas, their results have suggested that inequities in medical care caused by income differences in urban areas may be relevant [48]. A study using KNHANES data showed that only some differences in chronic disease management between urban and rural areas were statistically significant; however, when urban residents were compared to one another, more statistically significant differences were found in chronic disease management. Hence, larger gaps in income and education level among urban residents may lead to larger discrepancies in health indicators, compared to rural residents, who have been found to be more homogeneous in terms of socioeconomic indices [49].
- A comparison of the normal group and sarcopenic obesity group showed large differences in age (56.0 vs 71.7 years) as well as other socioeconomic indices (Table 2). Increased age can lead to a transition from a normal weight to obesity, sarcopenia, or sarcopenic obesity. Since our analysis was a cross-sectional study, it is hard to determine which factor was the most relevant for the increasing prevalence of sarcopenic obesity as individuals grew older. Therefore, longitudinal studies are needed to understand which factors other than aging contribute most to sarcopenic obesity occurring through the aging process.
- To our knowledge, this is the first study examining the association of overall diet quality with probable sarcopenia and sarcopenic obesity, measured with simple HGS. Our study confirmed that it is feasible for sarcopenia-related studies to follow the advice by the AWGS that PS can be assessed by HGS, which allows the evaluation of muscle function without a complicated X-ray examination. Diet quality was found to be consistently lower among participants from rural areas compared to their urban counterparts, which may be used as basic evidence to establish policies that can enhance diet quality among rural residents. However, the correlation of diet quality with sarcopenic obesity and sarcopenia was more prominent among urban residents than among their rural counterparts. Since there is abundant evidence suggesting that sarcopenic obesity may worsen with aging and may have negative effects on physical function, interventions for vulnerable elderly individuals in urban areas also need to be developed.
- Despite the strengths of this study, a few limitations should be considered when interpreting the results. Our study included participants aged 40 years or older because obesity and sarcopenia begin to develop at this age [30]. Since our main research goal was to examine KHEI scores and their association with sarcopenia and obesity, stratified by type of residential area, we did not further stratify the participants based on age. Although all the statistical models were adjusted for gender and age, it would be meaningful to perform additional analyses to determine whether the patterns are similar when the models are stratified by participants’ ages. In addition, a causal relationship could not be determined, reflecting an inherent limitation of cross-sectional studies.
- Our study results provide insights into the associations of diet quality with obesity, sarcopenia, and sarcopenic obesity among representative Korean middle-aged and elderly adults in both urban and rural areas. Future studies are warranted to investigate dietary interventions that may reduce sarcopenia, obesity, and sarcopenic obesity, with tailored strategies for rural and urban residents.
DISCUSSION
-
CONFLICT OF INTEREST
The authors have no conflicts of interest to declare for this study.
-
FUNDING
This study was supported by the Korean Society of Community Nutrition and the Korea Disease Control and Prevention Agency (ISSN 2733-5488) and Basic Science Research Program through the National Research Foundation of Korea (NRF), funded by the Ministry of Education (2021R1A6A1A03044501).
-
AUTHOR CONTRIBUTIONS
Both authors contributed equally to conceiving the study, analyzing the data, and writing this paper.
NOTES
ACKNOWLEDGEMENTS

| Characteristics | Total (n) | Urban | Rural | p-value1 | |
|---|---|---|---|---|---|
| Age (yr) | <0.001 | ||||
| 40-64 | 4,757 | 3,859 (77.6) [0.75] | 898 (65.8) [2.36] | ||
| ≥65 | 2,394 | 1,667 (22.4) [0.75] | 727 (34.2) [2.36] | ||
| Gender | 0.204 | ||||
| Men | 3,133 | 2,402 (51.0) [0.69] | 731 (53.2) [1.60] | ||
| Women | 4,018 | 3,124 (49.0) [0.69] | 894 (46.8) [1.60] | ||
| Household type | <0.001 | ||||
| Single member | 941 | 654 (8.8) [0.53] | 287 (13.8) [1.32] | ||
| Non-single | 6,210 | 4,872 (91.2) [0.53] | 1,338 (86.2) [1.32] | ||
| Household income | <0.001 | ||||
| Lowest | 1,643 | 1,075 (15.8) [0.77] | 568 (30.9) [2.56] | ||
| Lower middle | 1,733 | 1,283 (21.8) [0.80] | 450 (26.4) [1.58] | ||
| Upper middle | 1,749 | 1,428 (27.8) [0.83] | 321 (23.2) [1.96] | ||
| Highest | 2,005 | 1,723 (34.5) [1.21] | 282 (19.5) [1.87] | ||
| Education level | <0.001 | ||||
| ≤Elementary school | 1,913 | 1,245 (18.4) [0.78] | 668 (34.9) [2.31] | ||
| Middle school | 870 | 633 (10.9) [0.54] | 237 (15.2) [1.39] | ||
| High school | 2,047 | 1,666 (33.5) [0.88] | 381 (31.1) [1.90] | ||
| ≥ College | 1,964 | 1,734 (37.3) [1.23] | 230 (18.9) [1.76] | ||
| Smoking | 0.016 | ||||
| Current smoker | 1,219 | 931 (20.7) [0.74] | 288 (25.1) [1.58] | ||
| Past smoker | 1,618 | 1,266 (25.1) [0.66] | 352 (22.6) [1.30] | ||
| Never | 4,241 | 3,279 (54.2) [0.73] | 962 (52.3) [1.88] | ||
| Alcohol consumption | 0.001 | ||||
| No | 3,492 | 2,601 (43.2) [0.80] | 891 (49.8) [1.77] | ||
| Yes | 3,590 | 2,875 (56.8) [0.80] | 715 (50.2) [1.77] | ||
| Physical activity | <0.001 | ||||
| No | 4,259 | 3,148 (58.5) [0.93] | 1,111 (70.0) [1.64] | ||
| Yes | 2,523 | 2,122 (41.5) [0.93] | 401 (30.0) [1.64] | ||
| Food security | 0.991 | ||||
| Sufficient | 3,773 | 2,920 (54.1) [1.09] | 853 (53.8) [2.10] | ||
| Quality insufficient | 3,160 | 2,435 (43.1) [1.06] | 725 (43.4) [2.04] | ||
| Quality and quantity insufficient | 218 | 171 (2.8) [0.32] | 47 (2.8) [0.75] | ||
| No. of chronic diseases2 | 0.060 | ||||
| 0-1 | 6,046 | 4,714 (87.7) [0.49] | 1,332 (85.0) [1.21] | ||
| 2 | 892 | 659 (10.1) [0.46] | 233 (12.0) [1.12] | ||
| 3 | 213 | 153 (2.2) [0.23] | 60 (2.9) [0.43] | ||
| Sarcopenic obesity status | <0.001 | ||||
| Normal | 4,293 | 3,452 (64.7) [0.83] | 841 (54.7) [1.43] | ||
| Obesity | 1,801 | 1,362 (24.9) [0.76] | 439 (28.1) [1.38] | ||
| Sarcopenia | 613 | 418 (6.1) [0.37] | 195 (10.3) [0.93] | ||
| Sarcopenic obesity | 444 | 294 (4.2) [0.31] | 150 (6.8) [0.76] | ||
| Korea Healthy Eating Index score, mean±standard error | |||||
| Total | 65.03±0.21 | 65.37±0.23 | 63.39±0.49 | <0.0013 | |
| Adequacy | 32.15±0.18 | 32.39±0.19 | 30.91±0.43 | 0.0023 | |
| Moderation | 24.09±0.08 | 23.99±0.09 | 24.59±0.19 | 0.0053 | |
| Energy balance | 8.79±0.07 | 8.97±0.08 | 7.88±0.18 | <0.0013 | |
Values are presented as unweighted number (weighted %) [standard error].
1 Using the chi-square test, accounting for the complex survey design.
2 The number of chronic disease was categorized into 3 groups according to the number of diseases diagnosed among hypertension, diabetes, and dyslipidemia.
3 Using regression models after taking into account the complex survey design.
| Characteristics | Total (n) | Normal | Obesity | Sarcopenia | Sarcopenic obesity | p-value1 | |
|---|---|---|---|---|---|---|---|
| Area | <0.001 | ||||||
| Urban | 5,526 | 3,452 (85.6) [1.44] | 1,362 (81.6) [1.89] | 418 (74.9) [2.92] | 294 (75.4) [3.04] | ||
| Rural | 1,625 | 841 (14.4) [1.44] | 439 (18.4) [1.89] | 195 (25.1) [2.92] | 150 (24.6) [3.04] | ||
| Age (yr) | <0.001 | ||||||
| 40-64 | 4,757 | 3,318 (83.8) [0.64] | 1,169 (74.9) [1.28] | 182 (36.2) [2.40] | 88 (25.1) [2.59] | ||
| ≥65 | 2,394 | 975 (16.2) [0.64] | 632 (25.1) [1.28] | 431 (63.8) [2.40] | 356 (74.9) [2.59] | ||
| Gender | <0.001 | ||||||
| Men | 3,133 | 1,902 (51.9) [0.85] | 894 (58.1) [1.36] | 172 (30.0) [2.33] | 165 (39.3) [2.82] | ||
| Women | 4,018 | 2,391 (48.1) [0.85] | 907 (41.9) [1.36] | 441 (70.0) [2.33] | 279 (60.7) [2.82] | ||
| Household type | <0.001 | ||||||
| Single member | 941 | 444 (8.0) [0.53] | 239 (9.5) [0.82] | 153 (19.1) [1.55] | 105 (17.9) [2.00] | ||
| Non-single | 6,210 | 3,849 (92.0) [0.53] | 1,562 (90.5) [0.82] | 460 (80.9) [1.55] | 339 (82.1) [2.00] | ||
| Household income | <0.001 | ||||||
| Lowest | 1,643 | 659 (12.6) [0.69] | 433 (19.7) [1.21] | 316 (46.9) [2.57] | 235 (48.4) [3.09] | ||
| Lower middle | 1,733 | 1,022 (22.2) [0.86] | 462 (22.9) [1.28] | 137 (23.4) [2.06] | 112 (25.7) [2.49] | ||
| Upper middle | 1,749 | 1,162 (28.7) [0.92] | 448 (28.3) [1.46] | 85 (15.5) [1.78] | 54 (14.2) [2.23] | ||
| Highest | 2,005 | 1,440 (36.6) [1.24] | 454 (29.1) [1.49] | 71 (14.1) [1.92] | 40 (11.7) [2.10] | ||
| Education level | <0.001 | ||||||
| ≤Elementary school | 1,913 | 766 (14.3) [0.67] | 533 (22.5) [1.21] | 335 (52.3) [2.76] | 279 (62.9) [2.90] | ||
| Middle school | 870 | 519 (10.9) [0.55] | 241 (12.8) [0.97] | 61 (11.5) [1.59] | 49 (13.5) [2.18] | ||
| High school | 2,047 | 1,393 (35.9) [0.95] | 500 (32.1) [1.50] | 99 (22.6) [2.19] | 55 (14.3) [1.98] | ||
| ≥College | 1,964 | 1,426 (38.8) [1.21] | 453 (32.7) [1.63] | 57 (13.6) [2.12] | 28 (9.3) [1.89] | ||
| Smoking | <0.001 | ||||||
| Current smoker | 1,219 | 761 (22.1) [0.82] | 350 (23.8) [1.36] | 64 (12.4) [1.63] | 44 (11.7) [2.08] | ||
| Past smoker | 1,618 | 954 (24.4) [0.76] | 471 (28.0) [1.36] | 103 (18.4) [1.93] | 90 (19.5) [2.14] | ||
| Never | 4,241 | 2,548 (53.5) [0.87] | 966 (48.2) [1.46] | 428 (69.2) [2.37] | 299 (68.8) [2.84] | ||
| Alcohol consumption | <0.001 | ||||||
| No | 3,492 | 1,931 (41.3) [0.94] | 839 (40.9) [1.36] | 426 (70.9) [2.23] | 296 (65.3) [2.74] | ||
| Yes | 3,590 | 2,332 (58.7) [0.94] | 948 (59.1) [1.36] | 172 (29.1) [2.23] | 138 (34.7) [2.74] | ||
| Physical activity | <0.001 | ||||||
| No | 4,259 | 2,380 (56.2) [1.03] | 1,151 (64.8) [1.40] | 407 (72.4) [2.36] | 321 (77.6) [2.47] | ||
| Yes | 2,523 | 1,720 (43.8) [1.03] | 576 (35.2) [1.40] | 140 (27.6) [2.36] | 87 (22.4) [2.47] | ||
| Food security | <0.001 | ||||||
| Sufficient | 3,773 | 2,345 (55.4) [1.12] | 968 (54.5) [1.56] | 255 (43.6) [2.47] | 205 (48.5) [2.82] | ||
| Quality insufficient | 3,160 | 1,843 (42.4) [1.10] | 782 (42.4) [1.53] | 326 (50.9) [2.51] | 209 (45.5) [2.90] | ||
| Quality and quantity insufficient | 218 | 105 (2.1) [0.31] | 51 (3.1) [0.60] | 32 (5.4) [1.09] | 30 (6.0) [1.25] | ||
| No. of chronic diseases2 | <0.001 | ||||||
| 0-1 | 6,046 | 3,860 (91.4) [0.49] | 1,383 (81.1) [0.99] | 518 (85.7) [1.54] | 285 (66.1) [2.81] | ||
| 2 | 892 | 368 (7.5) [0.46] | 319 (14.3) [0.88] | 78 (11.8) [1.46] | 127 (27.3) [2.63] | ||
| 3 | 213 | 65 (1.1) [0.16] | 99 (4.6) [0.55] | 17 (2.6) [0.65] | 32 (6.5) [1.61] | ||
Values are presented as unweighted number (weighted %) [standard error].
Normal, non-sarcopenia and non-obesity; Obesity, non-sarcopenia and obesity; Sarcopenia, sarcopenia and non-obesity; Sarcopenic obesity, sarcopenia and obesity.
1 Using the chi-square test, accounting for the complex survey design.
2 The number of chronic diseases was categorized into 3 groups according to the number of diseases diagnosed among hypertension, diabetes, and dyslipidemia.
Values are presented as odds ratio (95% confidence interval).
Normal, non-sarcopenia and non-obesity; Obesity, non-sarcopenia and obesity; Sarcopenia, sarcopenia and non-obesity; Sarcopenic obesity, sarcopenia and obesity.
1 The explanatory variable was KHEI in a continuous format; Odds ratios were obtained using multinomial logistic regression models after adjusting for age, gender, household type, household income, education, smoking, drinking, physical activity, food security status, and the number of chronic diseases; The odds ratios can be interpreted as the risk for obesity, sarcopenia, or sarcopenic obesity relative to normal status if a subject’s KHEI score were to increase by 1 unit, with the other variables in the model held constant.
- 1. Baumgartner RN. Body composition in healthy aging. Ann N Y Acad Sci 2000;904:437-448.ArticlePubMed
- 2. Song MY, Ruts E, Kim J, Janumala I, Heymsfield S, Gallagher D. Sarcopenia and increased adipose tissue infiltration of muscle in elderly African American women. Am J Clin Nutr 2004;79:874-880.ArticlePubMed
- 3. Esmaili H, Mohd Yusof R, Abu Saad H, Ghaemian A, Darani Zad N. Association of dietary patterns with sociodemographic and health-related factors among coronary artery disease (CAD) patients. Ecol Food Nutr 2015;54:4-19.ArticlePubMed
- 4. Janssen I, Heymsfield SB, Ross R. Low relative skeletal muscle mass (sarcopenia) in older persons is associated with functional impairment and physical disability. J Am Geriatr Soc 2002;50:889-896.ArticlePubMed
- 5. Cao L, Morley JE. Sarcopenia Is recognized as an independent condition by an International Classification of Disease, tenth revision, Clinical Modification (ICD-10-CM) code. J Am Med Dir Assoc 2016;17:675-677.ArticlePubMed
- 6. Tanimoto Y, Watanabe M, Sun W, Sugiura Y, Tsuda Y, Kimura M, et al. Association between sarcopenia and higher-level functional capacity in daily living in community-dwelling elderly subjects in Japan. Arch Gerontol Geriatr 2012;55:e9-e13.ArticlePubMed
- 7. Tanimoto Y, Watanabe M, Sun W, Sugiura Y, Hayashida I, Kusabiraki T, et al. Sarcopenia and falls in community-dwelling elderly subjects in Japan: defining sarcopenia according to criteria of the European Working Group on Sarcopenia in Older People. Arch Gerontol Geriatr 2014;59:295-299.ArticlePubMed
- 8. Kim TN, Park MS, Yang SJ, Yoo HJ, Kang HJ, Song W, et al. Prevalence and determinant factors of sarcopenia in patients with type 2 diabetes: the Korean Sarcopenic Obesity Study (KSOS). Diabetes Care 2010;33:1497-1499.PubMedPMC
- 9. Landi F, Cruz-Jentoft AJ, Liperoti R, Russo A, Giovannini S, Tosato M, et al. Sarcopenia and mortality risk in frail older persons aged 80 years and older: results from ilSIRENTE study. Age Ageing 2013;42:203-209.ArticlePubMed
- 10. Cruz-Jentoft AJ, Bahat G, Bauer J, Boirie Y, Bruyère O, Cederholm T, et al. Sarcopenia: revised European consensus on definition and diagnosis. Age Ageing 2019;48:16-31.ArticlePubMedPDF
- 11. Chen LK, Woo J, Assantachai P, Auyeung TW, Chou MY, Iijima K, et al. Asian Working Group for Sarcopenia: 2019 consensus update on sarcopenia diagnosis and treatment. J Am Med Dir Assoc 2020;21:300-307.e2.ArticlePubMed
- 12. Cruz-Jentoft AJ, Baeyens JP, Bauer JM, Boirie Y, Cederholm T, Landi F, et al. Sarcopenia: European consensus on definition and diagnosis: report of the European Working Group on Sarcopenia in Older People. Age Ageing 2010;39:412-423.PubMedPMC
- 13. Roubenoff R. Sarcopenic obesity: the confluence of two epidemics. Obes Res 2004;12:887-888.ArticlePubMed
- 14. Hughes VA, Roubenoff R, Wood M, Frontera WR, Evans WJ, Fiatarone Singh MA. Anthropometric assessment of 10-y changes in body composition in the elderly. Am J Clin Nutr 2004;80:475-482.ArticlePubMed
- 15. Hernández-Ono A, Monter-Carreola G, Zamora-González J, Cardoso-Saldaña G, Posadas-Sánchez R, Torres-Tamayo M, et al. Association of visceral fat with coronary risk factors in a population-based sample of postmenopausal women. Int J Obes Relat Metab Disord 2002;26:33-39.ArticlePubMedPDF
- 16. Pi-Sunyer FX. The epidemiology of central fat distribution in relation to disease. Nutr Rev 2004;62:S120-S126.ArticlePubMed
- 17. Kong HH, Won CW, Kim W. Effect of sarcopenic obesity on deterioration of physical function in the elderly. Arch Gerontol Geriatr 2020;89:104065.ArticlePubMed
- 18. Someya Y, Tamura Y, Kaga H, Sugimoto D, Kadowaki S, Suzuki R, et al. Sarcopenic obesity is associated with cognitive impairment in community-dwelling older adults: the Bunkyo Health Study. Clin Nutr 2022;41:1046-1051.ArticlePubMed
- 19. Uchitomi R, Oyabu M, Kamei Y. Vitamin D and sarcopenia: potential of vitamin D supplementation in sarcopenia prevention and treatment. Nutrients 2020;12:3189.ArticlePubMedPMC
- 20. Park Y, Choi JE, Hwang HS. Protein supplementation improves muscle mass and physical performance in undernourished prefrail and frail elderly subjects: a randomized, double-blind, placebo-controlled trial. Am J Clin Nutr 2018;108:1026-1033.ArticlePubMed
- 21. Bollwein J, Diekmann R, Kaiser MJ, Bauer JM, Uter W, Sieber CC, et al. Dietary quality is related to frailty in community-dwelling older adults. J Gerontol A Biol Sci Med Sci 2013;68:483-489.ArticlePubMed
- 22. León-Muñoz LM, Guallar-Castillón P, López-García E, RodríguezArtalejo F. Mediterranean diet and risk of frailty in communitydwelling older adults. J Am Med Dir Assoc 2014;15:899-903.ArticlePubMed
- 23. Paddon-Jones D, Rasmussen BB. Dietary protein recommendations and the prevention of sarcopenia. Curr Opin Clin Nutr Metab Care 2009;12:86-90.ArticlePubMedPMC
- 24. Yokoyama Y, Nishi M, Murayama H, Amano H, Taniguchi Y, Nofuji Y, et al. Dietary variety and decline in lean mass and physical performance in community-dwelling older Japanese: a 4-year follow-up study. J Nutr Health Aging 2017;21:11-16.ArticlePubMedPDF
- 25. Park S, Kim HJ, Kim K. Do where the elderly live matter? Factors associated with diet quality among Korean elderly population living in urban versus rural areas. Nutrients 2020;12:1314.ArticlePubMedPMC
- 26. Cohen SA, Cook SK, Sando TA, Sabik NJ. What aspects of rural life contribute to rural-urban health disparities in older adults? Evidence from a national survey. J Rural Health 2018;34:293-303.ArticlePubMedPDF
- 27. Eberhardt MS, Pamuk ER. The importance of place of residence: examining health in rural and nonrural areas. Am J Public Health 2004;94:1682-1686.ArticlePubMedPMC
- 28. Jang IY, Jung HW, Lee CK, Lee YS, Kim KI, Kim KW, et al. Rural and urban disparities in frailty and aging-related health conditions in Korea. J Am Geriatr Soc 2016;64:908-911.ArticlePubMedPMCPDF
- 29. Kweon S, Kim Y, Jang MJ, Kim Y, Kim K, Choi S, et al. Data resource profile: the Korea National Health and Nutrition Examination Survey (KNHANES). Int J Epidemiol 2014;43:69-77.ArticlePubMedPMC
- 30. Park HM. Current status of sarcopenia in Korea: a focus on Korean geripausal women. Ann Geriatr Med Res 2018;22:52-61.ArticlePubMedPMC
- 31. Roberts HC, Denison HJ, Martin HJ, Patel HP, Syddall H, Cooper C, et al. A review of the measurement of grip strength in clinical and epidemiological studies: towards a standardised approach. Age Ageing 2011;40:423-429.ArticlePubMed
- 32. Yook SM, Park S, Moon HK, Kim K, Shim JE, Hwang JY. Development of Korean Healthy Eating Index for adults using the Korea National Health and Nutrition Examination Survey data. J Nutr Health 2015;48:419-428 (Korean).Article
- 33. Yun S, Park S, Yook SM, Kim K, Shim JE, Hwang JY, et al. Development of the Korean Healthy Eating Index for adults, based on the Korea National Health and Nutrition Examination Survey. Nutr Res Pract 2022;16:233-247.ArticlePubMedPDF
- 34. Ross R, Neeland IJ, Yamashita S, Shai I, Seidell J, Magni P, et al. Waist circumference as a vital sign in clinical practice: a Consensus Statement from the IAS and ICCR Working Group on Visceral Obesity. Nat Rev Endocrinol 2020;16:177-189.ArticlePubMedPMCPDF
- 35. Panjikkaran ST, Kumari K. Augmenting BMI and waist-height ratio for establishing more efficient obesity percentiles among school-going children. Indian J Community Med 2009;34:135-139.ArticlePubMedPMC
- 36. Lee SY, Park HS, Kim DJ, Han JH, Kim SM, Cho GJ, et al. Appropriate waist circumference cutoff points for central obesity in Korean adults. Diabetes Res Clin Pract 2007;75:72-80.ArticlePubMed
- 37. Korea Centers for Disease Control and Prevention. Guidelines for the use of raw data in the National Health and Nutrition Survey (KNHANES)_ 7th (2016-2018); 2020 [cited 2023 Aug 24]. Available from: https://knhanes.kdca.go.kr/knhanes/sub03/sub03_02_05.do (Korean, author’s translation).
- 38. Ervin RB. Healthy Eating Index scores among adults, 60 years of age and over, by sociodemographic and health characteristics: United States, 1999-2002. Adv Data 2008;395:1-16.
- 39. Shim JE, Hwang JY, Kim K. Objective and perceived food environment and household economic resources related to food insecurity in older adults living alone in rural areas. BMC Geriatr 2019;19:234.ArticlePubMedPMCPDF
- 40. Dean WR, Sharkey JR. Rural and urban differences in the associations between characteristics of the community food environment and fruit and vegetable intake. J Nutr Educ Behav 2011;43:426-433.ArticlePubMedPMC
- 41. Lebel A, Noreau D, Tremblay L, Oberlé C, Girard-Gadreau M, Duguay M, et al. Identifying rural food deserts: methodological considerations for food environment interventions. Can J Public Health 2016;107(Suppl 1):5353.ArticlePubMedPDF
- 42. Sharkey JR. Measuring potential access to food stores and food-service places in rural areas in the U. S. Am J Prev Med 2009;36(4 Suppl):S151-S155.
- 43. Hotamisligil GS, Murray DL, Choy LN, Spiegelman BM. Tumor necrosis factor alpha inhibits signaling from the insulin receptor. Proc Natl Acad Sci U S A 1994;91:4854-4858.ArticlePubMedPMC
- 44. Reaven GM. Banting lecture 1988. Role of insulin resistance in human disease. Diabetes 1988;37:1595-1607.ArticlePubMed
- 45. Roubenoff R. Sarcopenic obesity: does muscle loss cause fat gain? Lessons from rheumatoid arthritis and osteoarthritis. Ann N Y Acad Sci 2000;904:553-557.PubMed
- 46. Stephen WC, Janssen I. Sarcopenic-obesity and cardiovascular disease risk in the elderly. J Nutr Health Aging 2009;13:460-466.ArticlePubMedPDF
- 47. Villareal DT, Banks M, Siener C, Sinacore DR, Klein S. Physical frailty and body composition in obese elderly men and women. Obes Res 2004;12:913-920.ArticlePubMed
- 48. Banerjee S. Determinants of rural-urban differential in healthcare utilization among the elderly population in India. BMC Public Health 2021;21:939.ArticlePubMedPMCPDF
- 49. Jeon YJ, Kim CR, Park JS, Choi KH, Kang MJ, Park SG, et al. Health inequalities in hypertension and diabetes management among the poor in urban areas: a population survey analysis in South Korea. BMC Public Health 2016;16:492.ArticlePubMedPMC
REFERENCES
Figure & Data
References
Citations
- Association of Dietary Protein Sources and Their Adequacy, Body Composition and Risk of Sarcopenic Obesity in South Korean Populations: A Cross-Sectional Study
Jieun Kim, Kyoungsik Jeong, Sueun Lim, Siwoo Lee, Younghwa Baek
Metabolites.2024; 14(2): 130. CrossRef - Association of Combining Diet and Physical Activity on Sarcopenia and Obesity in Elderly Koreans with Diabetes
Sohye Kim, Soojeong Kim, Kyung Hee Hong
Nutrients.2024; 16(7): 964. CrossRef - Longitudinal association between soft drink consumption and handgrip strength in adults: a prospective analysis from the Tianjin Chronic Low-Grade Systemic Inflammation and Health (TCLSIH) cohort study
Tongfeng Liu, Shengxin Quan, Ge Meng, Hongmei Wu, Yeqing Gu, Shunming Zhang, Xuena Wang, Juanjuan Zhang, Qing Zhang, Li Liu, Shaomei Sun, Xing Wang, Ming Zhou, Qiyu Jia, Kun Song, Zhongze Fang, Kaijun Niu
British Journal of Nutrition.2024; : 1. CrossRef - Sex-Specific Effects of Dietary Factors on Sarcopenic Obesity in Korean Elderly: A Nationwide Cross-Sectional Study
Soojeong Kim, Kyung Hee Hong
Nutrients.2024; 16(8): 1175. CrossRef
 PubReader
 ePub Link
 Cite
Cite- Figure
-


- Related articles
-
- Changes in food sufficiency among Korean adults in urban and rural areas during the COVID-19 pandemic: an analysis of the 7th and 8th Korea National Health and Nutrition Examination Survey
- Mediating effect of lower extremity muscle on the relationship between obesity and osteoarthritis in middle-aged and elderly women in Korea: based on the 2009-2011 Korea National Health and Nutrition Examination Survey
- Associations of the magnesium depletion score and magnesium intake with diabetes among US adults: an analysis of the National Health and Nutrition Examination Survey 2011-2018
- Folate, vitamin B12, and homocysteine status in the Korean population: data from the 2013-2015 Korea National Health and Nutrition Examination Survey
- Higher energy consumption in the evening is associated with increased odds of obesity and metabolic syndrome: findings from the 2016-2018 Korea National Health and Nutrition Examination Survey (7th KNHANES)

