Articles
- Page Path
- HOME > Epidemiol Health > Volume 42; 2020 > Article
-
COVID-19
Original Article
Prediction of COVID-19 transmission dynamics using a mathematical model considering behavior changes in Korea -
Soyoung Kim1
 , Yu Bin Seo2, Eunok Jung1
 -
Epidemiol Health 2020;42:e2020026.
DOI: https://doi.org/10.4178/epih.e2020026
Published online: April 13, 2020
1Department of Mathematics, Konkuk University, Seoul, Korea
2Division of Infectious Diseases, Department of Internal Medicine, Hallym University College of Medicine, Chuncheon, Korea
- Correspondence: Eunok Jung Department of Mathematics, Konkuk University, 120 Neungdong-ro, Gwangjin-gu, Seoul 05029, Korea E-mail: junge@konkuk.ac.kr
©2020, Korean Society of Epidemiology
This is an open-access article distributed under the terms of the Creative Commons Attribution License (http://creativecommons.org/licenses/by/4.0/), which permits unrestricted use, distribution, and reproduction in any medium, provided the original work is properly cited.
Abstract
-
OBJECTIVES
- Since the report of the first confirmed case in Daegu on February 18, 2020, local transmission of coronavirus disease 2019 (COVID-19) in Korea has continued. In this study, we aimed to identify the pattern of local transmission of COVID-19 using mathematical modeling and predict the epidemic size and the timing of the end of the spread.
-
METHODS
- We modeled the COVID-19 outbreak in Korea by applying a mathematical model of transmission that factors in behavioral changes. We used the Korea Centers for Disease Control and Prevention data of daily confirmed cases in the country to estimate the nationwide and Daegu/Gyeongbuk area-specific transmission rates as well as behavioral change parameters using a least-squares method.
-
RESULTS
- The number of transmissions per infected patient was estimated to be about 10 times higher in the Daegu/Gyeongbuk area than the average of nationwide. Using these estimated parameters, our models predicts that about 13,800 cases will occur nationwide and 11,400 cases in the Daegu/Gyeongbuk area until mid-June.
-
CONCLUSIONS
- We mathematically demonstrate that the relatively high per-capita rate of transmission and the low rate of changes in behavior have caused a large-scale transmission of COVID-19 in the Daegu/Gyeongbuk area in Korea. Since the outbreak is expected to continue until May, non-pharmaceutical interventions that can be sustained over the long term are required.
- In December 2019, a case of pneumonia of unknown cause occurred in Wuhan, China and was identified as a novel coronavirus infection in January 2020. Originating from Wuhan, the virus then spread to every region in China. Since the report of the first confirmed case outside China in Thailand on January 13, 2020, the virus has been spreading worldwide. On January 30, 2020, the World Health Organization (WHO) declared the outbreak a public health emergency of international concern [1]. According to the WHO situation reports No. 48 [2], a total of 53 countries so far, including Korea, Italy, and Japan are showing community transmission; there have been 80,859 confirmed cases in China and 24,727 confirmed cases outside of China as of March 8, 2020.
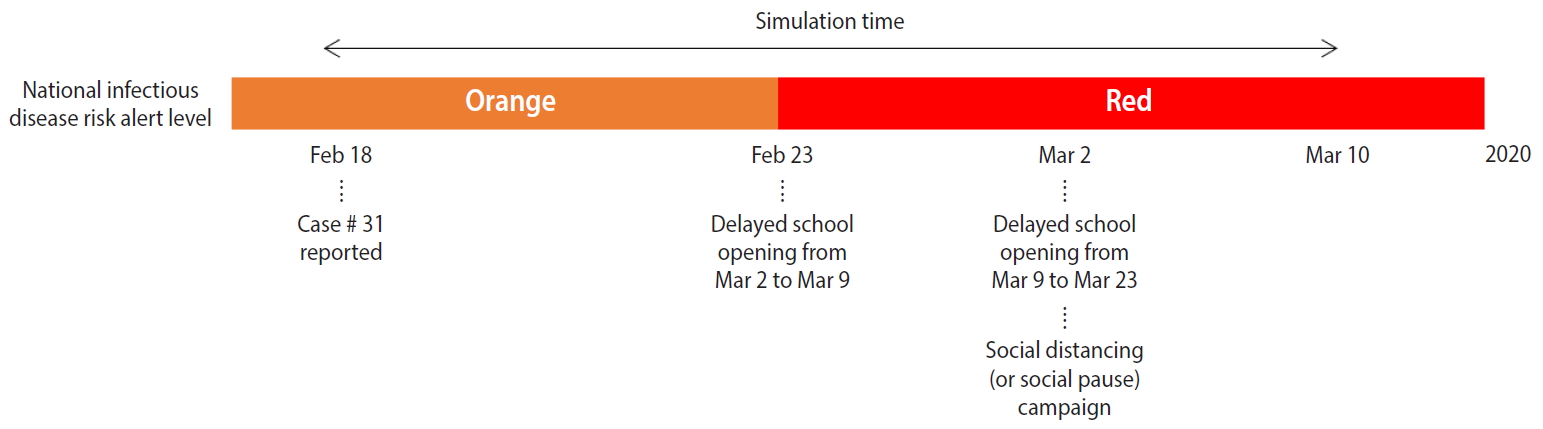
- In Korea, after the first confirmed case of coronavirus disease 2019 (COVID-19) on January 20, 2020, the epidemic has continued to spread. Prior to February 18, 2020, most confirmed cases were imported or a result of transmission via close contact with a confirmed patient, but since February 18, 2020, local transmission has led to a spread throughout the entire nation following outbreaks in religious communities and social welfare facilities. On February 23, 2020, the Korea Centers for Disease Control and Prevention (KCDC) raised the infectious disease alert level to “red,” the highest level, and declared that it would implement a containment policy including patient detection and isolation along with strategies to prevent and minimize local transmission [3]. The government is actively intervening by tracking and controlling those who have been in close contact and conducting disease prevention activities, while the public is making efforts to prevent the transmission through social distancing and improvements in personal hygiene. Figure 1 shows the infectious disease alert level and non-pharmaceutical interventions set in place by the government from February 18, 2020 to March 10, 2020.
- We applied a mathematical model that factors in the behavioral changes that were implemented in the population since local transmission began on February 18, 2020, to estimate the transmission rate. The model predicts the final size and the timing of the end of the epidemic as well as the maximum number of isolated individuals. While the number of confirmed cases continues to increase nationwide, the number of cases in the Daegu/Gyeongbuk area accounts for about 90% of all cases in Korea, and the incidence rate per 100,000 population in the Daegu/Gyeongbuk area, at 132.96 cases on average (Daegu, 232.42; Gyeongbuk, 41.95), is at least nine times higher than the national average of 14.49 (as of March 10, 2020) [4]. Our mathematical transmission model, therefore, discriminates between the national level and the Daegu/Gyeongbuk area. We, thus, analyzed the pattern of COVID-19 local transmission in Korea by mathematical modeling and simulations and estimated the relative risk by comparing epidemiological parameters between the national level and the Daegu/Gyeongbuk area.
INTRODUCTION
- Data
- We used the data from the KCDC daily press releases [5] and the daily confirmed cases from February 18, 2020, when the case #31 was confirmed, to March 10, 2020. The daily case data from February 18, 2020 to March 1, 2020 were updated at 9:00 a.m., while from March 2, 2020, data were updated at 0:00 a.m. We calculated the number of cases by region based on the initially reported cases. As an estimate of the total population, we used the resident registration data as of February 2020, provided by the Korean Statistical Information Service [6].
- Mathematical model
- We constructed a mathematical model of COVID-19 transmission based on the SEIR model with a hospital-quarantined group. A behavior-changed group, strives to reduce the transmission rate by social distancing and other measures, is also considered in this work. For the behavioral changes of the susceptible group, we modified the model of prevalence-based behavioral change proposed by Perra et al. [7] (global, prevalencebased spread of the fear of the disease) to fit the situation in Korea. The total population (N) consists of susceptible (S), behavior-changed susceptible (SF), virus-exposed (E), infectious (I), hospital-quarantined (Q), and recovered (R) individuals. Figure 2 shows the flow diagram of COVID-19 transmission according to our model, and the transmission dynamics can be described with the following differential equations.
- As the number of confirmed cases increases, the susceptible population moves to the behavior-changed susceptible group as people strive to improve personal hygiene, for example by wearing a mask, and practice social distancing, for example by refraining from mass gatherings or meetings, in awareness or fear of the spread of the virus. Both the normal susceptible group (S) that did not implement any changes in behavior as well as the behavior-changed susceptible group (SF) can be exposed to the virus via contact with infected patients, but we assumed that the probability of transmission is decreased in the behavior-changed susceptible group.
- Individuals who were exposed to the virus via contact with infectious patients move to the virus-exposed group (E) and develop symptoms (I) after the virus incubation period. After symptoms onset, infectious individuals (I) visit the hospital, become confirmed and quarantined (Q). Finally, they move to the recovered group (R) after a recovery period. In this study, we assumed that individuals are hospital quarantined after a confirmation and, thus, cannot infect others.
- We set the incubation period of the virus to 4.1 days, referring to the KCDC regular briefing on February 16, 2020 [8], and the mean period from symptom onset to confirm and isolation to 4 days [9]. Period from isolation to recovery was set to 14 days, which was the mean of 16 discharged patients according to the detailed information on confirmed cases reported until February 19, 2020. Mortality was not included in the present model as it was difficult to calculate the exact value at this point. Table 1 shows the description and values of the parameters used in the model. To define the initial value of the model, we used the #31 case confirmed on February 18, 2020 as Q(0).
- Ethics statement
- This research is based on data which is open to public. Neither ethical approval of an institutional review board nor written informed consent we required.
MATERIALS AND METHODS
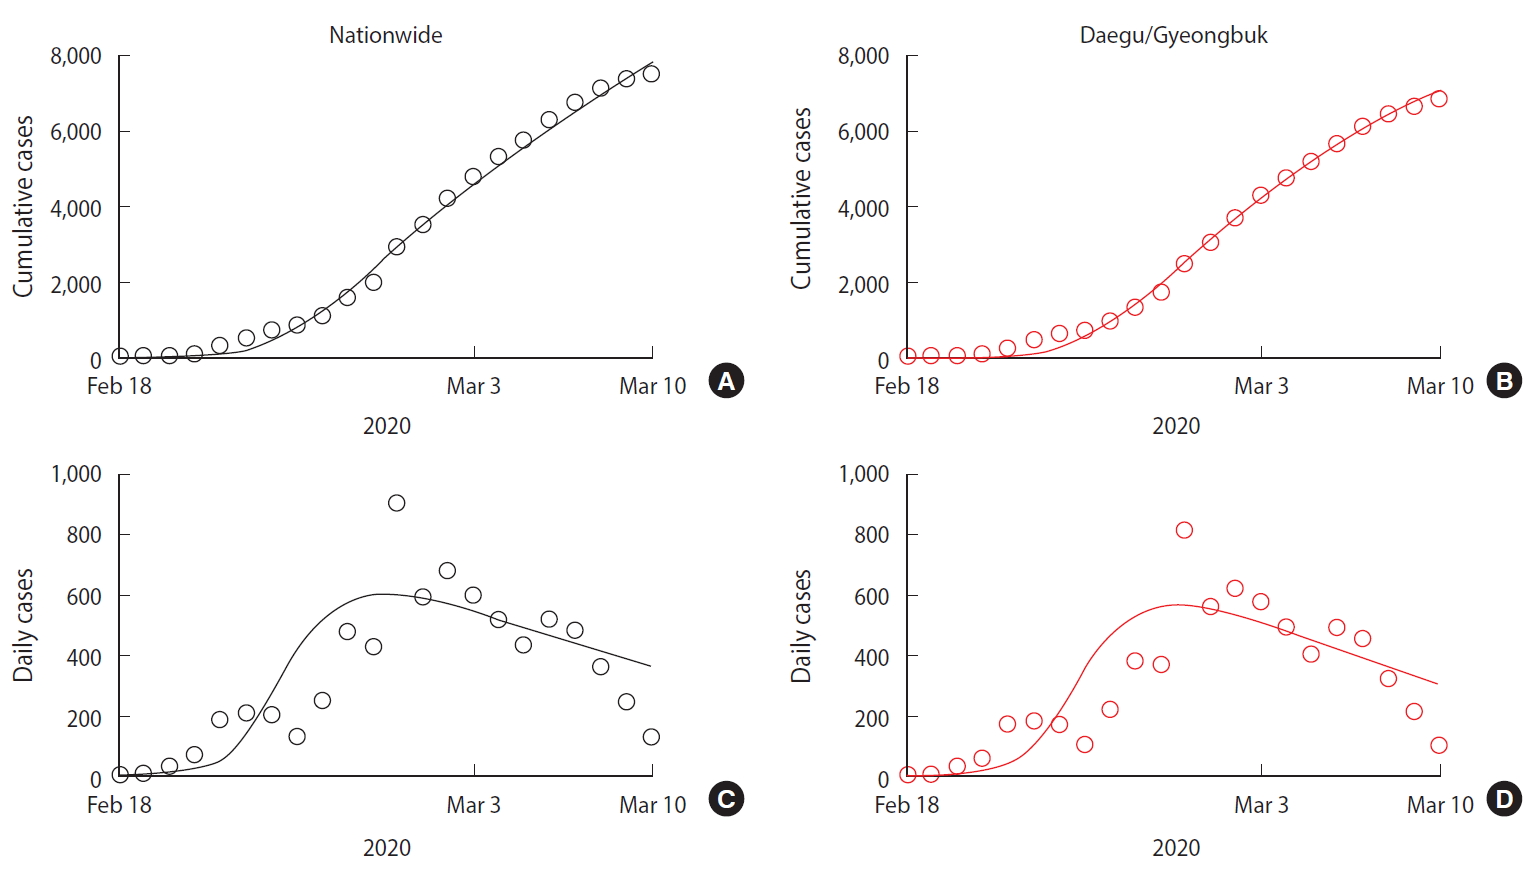
- To estimate the transmission rate and the rate of individuals moving from the susceptible to the behavior-changed susceptible group, we used a least-squares fitting method that minimizes the sum of the squares of the differences between the cumulative cases data and the model curve. The estimated values for all parameters, for the Daegu/Gyeongbuk area and nationwide, are presented in Table 1. Figure 3 shows the nationwide (A and C) and Daegu/Gyeongbuk (B and D) confirmed cases data (circle) from February 18, 2020 to March 10, 2020 together with the model estimation (solid curve). Figure 3A and 3B shows the number of cumulative confirmed cases and Figure 3C and 3D shows the number of new confirmed cases per day.
- We predicted the timing of the end of the COVID-19 outbreak and the total number of confirmed patients using the estimated parameters described above and obtained the following results. The end point of the COVID-19 outbreak is defined as a date that the number of expected daily new case is less than 1. Figure 4A shows the number of cumulative confirmed cases over time, while Figure 4B shows the number of isolated patients over time. The predicted values of nationwide cases are represented by the black solid line and the Daegu/Gyeongbuk cases by the red dashed line.
- Table 2 summarizes model predictions. According to the model, approximately 13,800 cases are expected to occur nationwide, and the date of the last confirmed case will be June 14, 2020. In the Daegu/Gyeongbuk region, approximately 11,400 cases are expected to occur until May 27, 2020. The proportion of Daegu/Gyeongbuk cases by the end of the outbreak is estimated at 82.7%. The number of cumulative cases per 100,000 people is predicted to be 26.49 nationwide and 224.64 in the Daegu/Gyeongbuk area. The number of isolated patients, both nationwide and in Daegu/Gyeongbuk, will peak on March 11, 2020, and then start to decrease. The maximum number of isolated individuals predicted by the model is 4,625 nationwide, of which 4,167 are predicted to be located in the Daegu/Gyeongbuk area.
RESULTS
- Assuming that the period from symptom onset to isolation is identical for the cases in the Daegu/Gyeongbuk area and those occurring nationwide, our model estimates the per-capita rate of transmission (β/N) to be at least 8.9 times higher in the Daegu/Gyeongbuk area, with 1.3616e-7 per infected patient nationwide and 1.2145e-6 around Daegu/Gyeongbuk. The transmission rate of the behavioral changes implemented in the Daegu/Gyeongbuk area is also estimated to be lower than that of the national average.
- In the early stages of the outbreak, the period from symptom onset to isolation was at least 5 days, but recently, most patients are confirmed and isolated within 1-2 days of symptom onset due to the active screening of close contacts by the KCDC. However, as there are still reports of cases of transmission after more than 5 days from symptom onset, we set the mean period from onset to isolation to 4 days in our model. The rate of reduction in transmission in the behavior-changed group significantly affects the model results. Since the rate of reduction in transmission that results from the currently implemented social distancing policies has never been studied, we factored in the number of people working at home and the delayed start of classes and concluded that the transmission rate will decrease by about 1/50 or more. In our model, a decrease in the parameter, which means transmission rate of behavior-changed susceptible is decreased more, results in a decrease in the total number of confirmed cases and the duration of the outbreak.
- In the present study, we assumed that the susceptible group that implemented behavioral changes maintains a low transmission rate. However, when schools open again after March 24, 2020, an increase in the number of contacts and a desensitization of the behavior-changed group with a decreasing number of patients may lead to another cluster outbreak stemming from unconfirmed positive cases.
- Since this model assumes that patients are isolated at diagnosis and cannot spread the virus further, the recovery period and mortality rate do not affect the total number of patients, but they only affect the calculation of the number of isolated patients and the required inpatient beds. The number of daily isolated patients increases with an increasing recovery period and decreases with an increasing mortality rate.
- The COVID-19 pandemic is characterized by large-scale cluster outbreaks in specific areas. A large-scale outbreak within a region beyond the capacity of local hospitals can lead to some confirmed patients having to self-quarantine, during which they might infect other people. It is, thus, necessary to predict the number of isolated patients over time through modeling to identify the number of beds required in advance and establish a response strategy.
- While in Korea, a large-scale outbreak occurred in the Daegu/Gyeongbuk area, the results of our mathematical model show that up to about 1,000 confirmed cases may occur in regions outside Daegu/Gyeongbuk as well. As part of the government’s active intervention policy, powerful non-pharmaceutical interventions such as postponing the start of classes in elementary/middle/high schools and reducing mass gatherings are being implemented. However, given that the outbreak is expected to continue through June 2020, it will be difficult to sustain the strengthened nonpharmaceutical interventions. Therefore, even after schools open again, it will be necessary to suggest sustainable non-pharmaceutical intervention guidelines, for example reinforcing personal hygiene practices such as mask wearing and hand washing, encouraging people to avoid close contact and visit a medical center quickly after suspicious symptoms develop, and shortening the time from symptom onset to isolation.
DISCUSSION
SUPPLEMENTARY MATERIALS
-
CONFLICT OF INTEREST
The authors have no conflicts of interest to declare for this study.
-
FUNDING
This work was supported by a Korea National Research Foundation (NRF) grant funded by the Korean government (MEST; grant No. NRF-2019R1A6A3A01091838) awarded to Kim and by a Korea NRF grant funded by the MEST (grant No. NRF-2017R1 A2B2004651) awarded to Jung. This paper was written as part of Konkuk University’s research support program for its faculty on sabbatical leave in 2019. The research presented here was also supported by a grant from the Korean Health Technology R&D Project, Ministry of Health & Welfare, Republic of Korea (grant No. HG18C0080).
-
AUTHOR CONTRIBUTIONS
Conceptualization: EJ. Data curation: SK. Formal analysis: SK, YBS. Funding acquisition: SK, EJ. Methodology: EJ. Project administration: EJ. Visualization: SK. Writing – original draft: SK. Writing – review & editing: EJ, YBS.
NOTES
ACKNOWLEDGEMENTS


| Symbol | Description |
Value |
Reference | |
|---|---|---|---|---|
| Nationwide | Daegu/Gyeongbuk | |||
| β | Transmission rate of coronavirus disease 2019 disease | 7.059 | 6.184 | Data-fitted |
| βF | Transmission rate of the awareness/fear of the disease | 4.811 | 4.085 | Data-fitted |
| 1/τ | Characteristic no. of confirmed individuals reported in the news | 1,000 | Assumed | |
| δ | Transmission reduction ratio of behavior-changed individuals | 0.02 | Assumed | |
| κ | Progression rate | 1/4.1 | [8] | |
| α | Isolation rate | 1/4 | [9] | |
| γ | Recovery rate | 1/14 | [5] | |
| Region | Maximum no. of isolated individuals | Peak of isolated individuals | Final size of epidemic1 | Final incidence rate per 100,000 | End of outbreak |
|---|---|---|---|---|---|
| Nationwide | 4,625 | Mar 11, 2020 | 13,830 | 26.49 | Jun 14, 2020 |
| Daegu/Gyeongbuk | 4,167 | Mar 11, 2020 | 11,438 | 224.64 | May 27, 2020 |
- 1. World Health Organization. Statement on the second meeting of the International Health Regulations (2005) Emergency Committee regarding the outbreak of novel coronavirus (2019-nCoV). 2020 Jan 30 [cited 2020 Mar 10]. Available from: https://www.who.int/news-room/detail/30-01-2020-statement-on-the-second-meeting-of-the-international-health-regulations-(2005)-emergency-committee-regarding-the-outbreak-of-novel-coronavirus-(2019-ncov).
- 2. World Health Organization. Coronavirus disease 2019 (COVID-19): situation report – 48. 2020 Mar 8 [cited 2020 Mar 10]. Available from: https://www.who.int/docs/default-source/coronaviruse/situation-reports/20200308-sitrep-48-covid-19.pdf?sfvrsn=16f7ccef_4.
- 3. Korea Centers for Disease Control and Prevention. Brief report of government meeting for COVID-19 spread in Korea [cited 2020 Apr 14]. Available from: http://ncov.mohw.go.kr/upload/viewer/skin/doc.html?fn=1582449957863_20200223182559.hwp&rs=/upload/viewer/result/202004/ (Korean, author’s translation).
- 4. Korea Centers for Disease Control and Prevention. Korean situation report of COVID-19. 2020 Mar 9 [cited 2020 Apr 14]. Available from: https://is.cdc.go.kr/upload_comm/syview/doc.html?fn=158371642528200.pdf&rs=/upload_comm/docu/0015/ (Korean, author’s translation).
- 5. Korea Centers for Disease Control and Prevention (KCDC). KCDC press [cited 2020 Apr 14]. Available from: https://www.cdc.go.kr/board/board.es?mid=a20501000000&bid=0015 (Korean, author’s translation).
- 6. Korean Statistical Information Service. Resident registration population by administrative district and age [cited 2020 Apr 14]. Available from: http://kosis.kr/statHtml/statHtml.do?orgId=101&tblId=DT_1B04006&conn_path= I2 (Korean, author’s translation).
- 7. Perra N, Balcan D, Goncalves B, Vespignani A. Towards a characterization of behavior-disease models. PLoS One 2011;6:e23084.
- 8. Korea Centers for Disease Control and Prevention. Korean situation report of COVID-19. 2020 Feb 16 [cited 2020 Apr 14]. Available from: https://is.cdc.go.kr/upload_comm/syview/doc.html?fn=158184011101700.hwp&rs=/upload_comm/docu/0015/ (Korean, author’s translation).ArticlePubMedPMC
- 9. Ki M; Task Force for 2019-nCoV. Epidemiologic characteristics of early cases with 2019 novel coronavirus (2019-nCoV) disease in Korea. Epidemiol Health 2020;42:e2020007.
REFERENCES
Figure & Data
References
Citations
- Mathematical Modeling of COVID-19 Transmission and Intervention in South Korea: A Review of Literature
Hyojung Lee, Sol Kim, Minyoung Jeong, Eunseo Choi, Hyeonjeong Ahn, Jeehyun Lee
Yonsei Medical Journal.2023; 64(1): 1. CrossRef - Numerical Scheme for Compartmental Models: New Matlab Software Codes for Numerical Simulation
Samuel Okyere, Joseph Ackora-Prah, Ebenezer Bonyah, Samuel Akwasi Adarkwa
F1000Research.2023; 12: 445. CrossRef - Factors Influencing Infection Anxiety in Korean Male Firefighters Due to COVID-19 Infection Status
Seung-Woo Han, Hyun-Ok Jung
Healthcare.2023; 11(11): 1623. CrossRef - Neural network method and multiscale modeling of the COVID-19 epidemic in Korea
Ziqian Li, Jiwei Jia, Guidong Liao, Young Ju Lee, Siyu Liu
The European Physical Journal Plus.2023;[Epub] CrossRef - Numerical Scheme for Compartmental Models: New Matlab Software Codes for Numerical Simulation
Samuel Okyere, Joseph Ackora-Prah, Ebenezer Bonyah, Samuel Akwasi Adarkwa
F1000Research.2023; 12: 445. CrossRef - Studying the Effect of Particulate Matter as SARS-CoV-2 Transmitters
Abdulrahim R. Hakami, Gasim Dobie
Journal of Public Health Research.2022; 11(1): jphr.2021.2521. CrossRef - Managing the resource allocation for the COVID-19 pandemic in healthcare institutions: a pluralistic perspective
Manimuthu Arunmozhi, Jinil Persis, V. Raja Sreedharan, Ayon Chakraborty, Tarik Zouadi, Hanane Khamlichi
International Journal of Quality & Reliability Management.2022; 39(9): 2184. CrossRef - Panel Associations Between Newly Dead, Healed, Recovered, and Confirmed Cases During COVID-19 Pandemic
Ming Guan
Journal of Epidemiology and Global Health.2022; 12(1): 40. CrossRef - Application of Mathematical Modeling in Prediction of COVID-19 Transmission Dynamics
Ali AlArjani, Md Taufiq Nasseef, Sanaa M. Kamal, B. V. Subba Rao, Mufti Mahmud, Md Sharif Uddin
Arabian Journal for Science and Engineering.2022; 47(8): 10163. CrossRef - Transmission dynamics model and the coronavirus disease 2019 epidemic: applications and challenges
Jinxing Guan, Yang Zhao, Yongyue Wei, Sipeng Shen, Dongfang You, Ruyang Zhang, Theis Lange, Feng Chen
Medical Review.2022; 2(1): 89. CrossRef - Interval type-2 fuzzy computational model for real time Kalman filtering and forecasting of the dynamic spreading behavior of novel Coronavirus 2019
Daiana Caroline dos Santos Gomes, Ginalber Luiz de Oliveira Serra
ISA Transactions.2022; 124: 57. CrossRef - Incorporating global dynamics to improve the accuracy of disease models: Example of a COVID-19 SIR model
Hadeel AlQadi, Majid Bani-Yaghoub, Yury E. Khudyakov
PLOS ONE.2022; 17(4): e0265815. CrossRef - A Mathematical Model of Transmission Dynamics of SARS-CoV-2 (COVID-19) with an Underlying Condition of Diabetes
Samuel Okyere, Joseph Ackora-Prah, Shih Pin Chen
International Journal of Mathematics and Mathematical Sciences.2022; 2022: 1. CrossRef - Impact of urbanisation and environmental factors on spatial distribution of COVID-19 cases during the early phase of epidemic in Singapore
Murali Krishna Gurram, Min Xian Wang, Yi-Chen Wang, Junxiong Pang
Scientific Reports.2022;[Epub] CrossRef - Compartmental structures used in modeling COVID-19: a scoping review
Lingcai Kong, Mengwei Duan, Jin Shi, Jie Hong, Zhaorui Chang, Zhijie Zhang
Infectious Diseases of Poverty.2022;[Epub] CrossRef - Multi-Faceted Analysis of COVID-19 Epidemic in Korea Considering Omicron Variant: Mathematical Modeling-Based Study
Youngsuk Ko, Victoria May Mendoza, Renier Mendoza, Yubin Seo, Jacob Lee, Jonggul Lee, Donghyok Kwon, Eunok Jung
Journal of Korean Medical Science.2022;[Epub] CrossRef - Investigating Online Learning Process in Business School: Case Study from Business School in Jakarta, Indonesia
Sekar W. Prasetyaningtyas, Agustian B. Prasetya
International Journal of Information and Education Technology.2022; 12(9): 964. CrossRef - Evolution and consequences of individual responses during the COVID-19 outbreak
Wasim Abbas, Masud M. A., Anna Park, Sajida Parveen, Sangil Kim, Siew Ann Cheong
PLOS ONE.2022; 17(9): e0273964. CrossRef - Managing bed capacity and timing of interventions: a COVID-19 model considering behavior and underreporting
Victoria May P. Mendoza, Renier Mendoza, Youngsuk Ko, Jongmin Lee, Eunok Jung
AIMS Mathematics.2022; 8(1): 2201. CrossRef - Model-informed COVID-19 exit strategy with projections of SARS-CoV-2 infections generated by variants in the Republic of Korea
Sung-mok Jung, Kyungmin Huh, Munkhzul Radnaabaatar, Jaehun Jung
BMC Public Health.2022;[Epub] CrossRef - Contribution to COVID-19 spread modelling: a physical phenomenological dissipative formalism
Oualid Limam, Mohamed Limam
Biomechanics and Modeling in Mechanobiology.2021; 20(1): 379. CrossRef - Computational Approach For Real-Time Interval Type-2 Fuzzy Kalman Filtering and Forecasting via Unobservable Spectral Components of Experimental Data
Daiana Caroline dos Santos Gomes, Ginalber Luiz de Oliveira Serra
Journal of Control, Automation and Electrical Systems.2021; 32(2): 326. CrossRef - Non-pharmaceutical interventions during the COVID-19 pandemic: A review
Nicola Perra
Physics Reports.2021; 913: 1. CrossRef - Machine Learning Model for Computational Tracking and Forecasting the COVID-19 Dynamic Propagation
Daiana Caroline dos Santos Gomes, Ginalber Luiz de Oliveira Serra
IEEE Journal of Biomedical and Health Informatics.2021; 25(3): 615. CrossRef - Graphs in the COVID-19 news: a mathematics audit of newspapers in Korea
Oh Nam Kwon, Chaereen Han, Changsuk Lee, Kyungwon Lee, Kyeongjun Kim, Gyeongha Jo, Gangwon Yoon
Educational Studies in Mathematics.2021; 108(1-2): 183. CrossRef - Pandemic velocity: Forecasting COVID-19 in the US with a machine learning & Bayesian time series compartmental model
Gregory L. Watson, Di Xiong, Lu Zhang, Joseph A. Zoller, John Shamshoian, Phillip Sundin, Teresa Bufford, Anne W. Rimoin, Marc A. Suchard, Christina M. Ramirez, Virginia E. Pitzer
PLOS Computational Biology.2021; 17(3): e1008837. CrossRef - Using the Weibull distribution to model COVID-19 epidemic data
Vitor Hugo Moreau
Model Assisted Statistics and Applications.2021; 16(1): 5. CrossRef - Segmentation and shielding of the most vulnerable members of the population as elements of an exit strategy from COVID-19 lockdown
Bram A. D. van Bunnik, Alex L. K. Morgan, Paul R. Bessell, Giles Calder-Gerver, Feifei Zhang, Samuel Haynes, Jordan Ashworth, Shengyuan Zhao, Roo Nicola Rose Cave, Meghan R. Perry, Hannah C. Lepper, Lu Lu, Paul Kellam, Aziz Sheikh, Graham F. Medley, Mark
Philosophical Transactions of the Royal Society B: Biological Sciences.2021;[Epub] CrossRef - A model and predictions for COVID-19 considering population behavior and vaccination
Thomas Usherwood, Zachary LaJoie, Vikas Srivastava
Scientific Reports.2021;[Epub] CrossRef - Behavioral Risk Modeling for Pandemics: Overcoming Challenges and Advancing the Science
Ellen P. Carlin, Koya C. Allen, Jeffrey J. Morgan, Jean-Paul Chretien, Suzan Murray, Deborah Winslow, Dawn Zimmerman
Health Security.2021; 19(4): 447. CrossRef - Structure of epidemic models: toward further applications in economics
Toshikazu Kuniya
The Japanese Economic Review.2021; 72(4): 581. CrossRef - How Important Is Behavioral Change during the Early Stages of the COVID-19 Pandemic? A Mathematical Modeling Study
Jongmin Lee, Seok-Min Lee, Eunok Jung
International Journal of Environmental Research and Public Health.2021; 18(18): 9855. CrossRef - Factors shaping the COVID-19 epidemic curve: a multi-country analysis
Su Yeon Jang, Laith Hussain-Alkhateeb, Tatiana Rivera Ramirez, Ahmed Asa’ad Al-Aghbari, Dhia Joseph Chackalackal, Rocio Cardenas-Sanchez, Maria Angelica Carrillo, In-Hwan Oh, Eduardo Andrés Alfonso-Sierra, Pia Oechsner, Brian Kibiwott Kirui, Martin Anto,
BMC Infectious Diseases.2021;[Epub] CrossRef - A Bidirectional Long Short-Term Memory Model Algorithm for Predicting COVID-19 in Gulf Countries
Theyazn H. H. Aldhyani, Hasan Alkahtani
Life.2021; 11(11): 1118. CrossRef - Health and pathology: a brief history of the biopolitics of US mathematics education
Ryan Ziols, Kathryn L. Kirchgasler
Educational Studies in Mathematics.2021; 108(1-2): 123. CrossRef - Robust optimal parameter estimation for the susceptible-unidentified infected-confirmed model
Chaeyoung Lee, Soobin Kwak, Sangkwon Kim, Youngjin Hwang, Yongho Choi, Junseok Kim
Chaos, Solitons & Fractals.2021; 153: 111556. CrossRef - Risk Perceptions, Knowledge and Behaviors of General and High-Risk Adult Populations Towards COVID-19: A Systematic Scoping Review
Nathalie Clavel, Janine Badr, Lara Gautier, Mélanie Lavoie-Tremblay, Jesseca Paquette
Public Health Reviews.2021;[Epub] CrossRef - Modeling COVID-19 Transmission Dynamics With Self-Learning Population Behavioral Change
Tsz-Lik Chan, Hsiang-Yu Yuan, Wing-Cheong Lo
Frontiers in Public Health.2021;[Epub] CrossRef - The first year of covid-19 in croatia - a mathematical model
Tibor Rodiger, Edgar Glavaš, Ivan Kovač
Croatian Regional Development Journal.2021; 2(2): 32. CrossRef - Covid-19 Predictions Using a Gauss Model, Based on Data from April 2
Janik Schüttler, Reinhard Schlickeiser, Frank Schlickeiser, Martin Kröger
Physics.2020; 2(2): 197. CrossRef - Preliminary Clinical and Epidemiological Analysis of the First 1,000 Pediatric COVID-19 Cases in Moscow Region
Elena R. Meskina
Journal of microbiology, epidemiology and immunobiology.2020; 97(3): 202. CrossRef - Forecast predictions for the COVID-19 pandemic in Brazil by statistical modeling using the Weibull distribution for daily new cases and deaths
Vitor Hugo Moreau
Brazilian Journal of Microbiology.2020; 51(3): 1109. CrossRef - Mathematical modeling for infectious viral disease: The COVID‐19 perspective
Hafeez Aderinsayo Adekola, Ibrahim Ayoade Adekunle, Haneefat Olabimpe Egberongbe, Sefiu Adekunle Onitilo, Idris Nasir Abdullahi
Journal of Public Affairs.2020;[Epub] CrossRef - Estimating the Transmission Risk of COVID-19 in Nigeria: A Mathematical Modelling Approach
Irany FA, Akwafuo SE, Abah T, Mikler AR
Journal of Health Care and Research.2020; 1(3): 135. CrossRef - Underlying Principles of a Covid-19 Behavioral Vaccine for a Sustainable Cultural Change
Kalliu Carvalho Couto, Flora Moura Lorenzo, Marco Tagliabue, Marcelo Borges Henriques, Roberta Freitas Lemos
International Journal of Environmental Research and Public Health.2020; 17(23): 9066. CrossRef - Understanding South Korea’s Response to the COVID-19 Outbreak: A Real-Time Analysis
Eunsun Jeong, Munire Hagose, Hyungul Jung, Moran Ki, Antoine Flahault
International Journal of Environmental Research and Public Health.2020; 17(24): 9571. CrossRef
 PubReader
 ePub Link
 Cite
Cite